. 2011 Apr 26;108(17):7010-5.
doi: 10.1073/pnas.1018658108. Epub 2011 Apr 11.

Revealing protein oligomerization and densities in situ using spatial intensity distribution analysis

Affiliations

Revealing protein oligomerization and densities in situ using spatial intensity distribution analysis

Antoine G Godin et al. Proc Natl Acad Sci U S A. .

Abstract

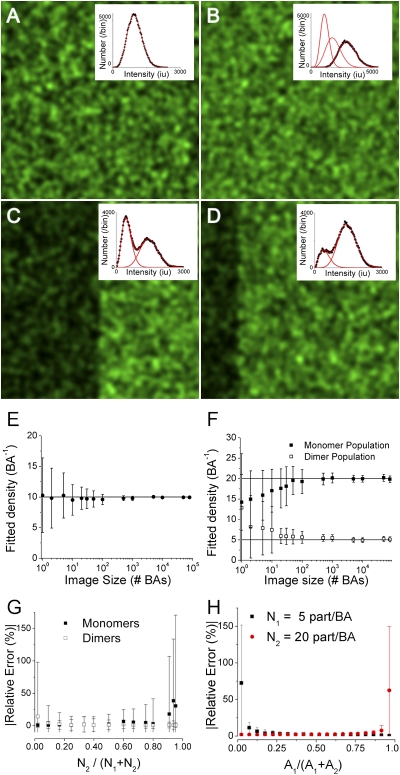
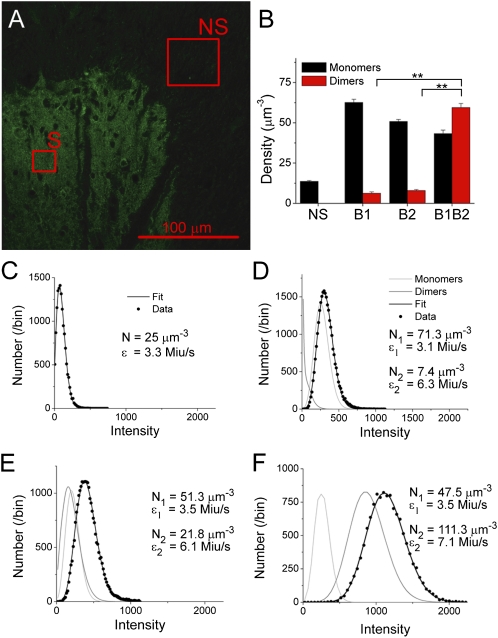
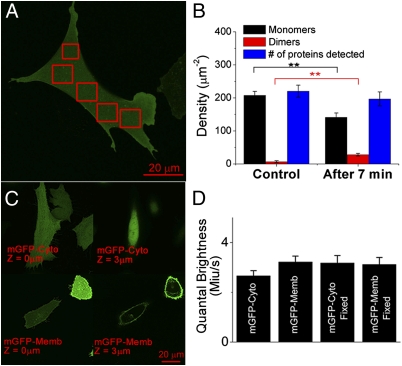
Measuring protein interactions is key to understanding cell signaling mechanisms, but quantitative analysis of these interactions in situ has remained a major challenge. Here, we present spatial intensity distribution analysis (SpIDA), an analysis technique for image data obtained using standard fluorescence microscopy. SpIDA directly measures fluorescent macromolecule densities and oligomerization states sampled within single images. The method is based on fitting intensity histograms calculated from images to obtain density maps of fluorescent molecules and their quantal brightness. Because spatial distributions are acquired by imaging, SpIDA can be applied to the analysis of images of chemically fixed tissue as well as live cells. However, the technique does not rely on spatial correlations, freeing it from biases caused by subcellular compartmentalization and heterogeneity within tissue samples. Analysis of computer-based simulations and immunocytochemically stained GABA(B) receptors in spinal cord samples shows that the approach yields accurate measurements over a broader range of densities than established procedures. SpIDA is applicable to sampling within small areas (6 μm(2)) and reveals the presence of monomers and dimers with single-dye labeling. Finally, using GFP-tagged receptor subunits, we show that SpIDA can resolve dynamic changes in receptor oligomerization in live cells. The advantages and greater versatility of SpIDA over current techniques open the door to quantificative studies of protein interactions in native tissue using standard fluorescence microscopy.


Conflict of interest statement

The authors declare no conflict of interest.

Figures

Fig. 1.
Fig. 1.
Validation of SpIDA using computer simulated data. A–D show simulated images. (A) A single-point emitter population, with No = 10 particles/BA and εo = 100 iu; the fit to Eq. 4 yielded NSpIDA = 9.6 particles/BA and εSpIDA = 104 iu. (B) Two intermixed populations made of monomers and dimers. NoM and NoD = 10 particles/BA, with εo = 100 iu. The fitted distribution to Eq. 6 (convolution of two independent populations) yielded NM-SpIDA = 9.6 with εM-SpIDA = 102 iu and ND-SpIDA = 10.2 particles/BA with εD-SpIDA = 198 iu. (C) Two monomeric (εo = 100 iu) populations segregated within equal area regions (left and right), with NoL = 5 and NoR = 15 particles/BA. The fit to Eq. 5 returned NL-SpIDA = 5.3 particles/BA with εL-SpIDA = 93 iu and NR-SpIDA = 14.5 particles/BA with εR-SpIDA = 102 iu. (D) Two monomeric populations segregated within two regions (left and right) that differ in area by a factor of four (100 and 400 BA, respectively). NoL = 5 and NoR = 15 particles/BA. The histogram fit to Eq. 5 returned NL-SpIDA = 4.5 with εL-SpIDA = 109 iu and NR-SpIDA = 14.3 particles/BA with εR-SpIDA = 103 iu. (E and F) Accuracy of SpIDA for one- and two-population images as a function of sample size (number of BAs). (G) Accuracy of SpIDA applied to images of monomer/dimer mixtures while varying the fraction of dimers. Fixed image size of 1,000 BAs was chosen for these simulations. The monomer density was fixed at 50 monomers/BA, whereas the dimer density varied from 1 to 1,000 dimers/BA. (H) Accuracy of SpIDA applied to segregated population images. The total image size was fixed to 1,000 BA. Each data point was obtained as the mean from analysis of 100 separate simulated images, and the error bars represent the SDs.
Fig. 2.
Fig. 2.
Detecting receptor oligomerization by immunocytochemistry in native tissue by SpIDA. (A) CLSM image of a spinal dorsal horn section in which only the GABAB1 subunits were detected by immunofluorescence. The pixel size is 0.058 μm. ROIs of analyzed regions with nonspecific (primary with secondary; NS) and specific labeling (S) are also shown; six regions per section were analyzed. C–F show examples of histograms fitted for the four types of samples analyzed with their corresponding fits and the best-fit values. (B) Results of SpIDA applied to the section incubated with anti-GABAB1 only, anti-GABAB2 only, and a mixture of the two antibodies. A total of 125 regions was analyzed for the nonspecific labeling taken from the three types of samples from five rats; 66 regions were analyzed for B1, 79 regions were analyzed for B2, and 60 regions were analyzed for both subunits combined. Error bars = SEM. **P < 0.01. (C–F) Examples of intensity distributions and fits of data from (C) a region where the labeled protein is not present (i.e., NS background), (D and E) samples where only one type of primary antibody was used to label the proteins (anti-B1 and anti-B2, respectively), and (F) a sample in which both types of primary antibodies were applied (labeling the GABAB heterodimer).
Fig. 3.
Fig. 3.
Detecting receptor oligomerization in live cells by SpIDA. (A) Image of CHO-k1 cells expressing EGFR-GFP before treatment with EGF. Boxes indicate the ROIs that were analyzed. (B) Shift in the distribution of monomers to dimers after the addition of EGF (20 nM; the experiment was performed at room temperature). The error bars represent the SE taken from five measurements. **P < 0.01 between monomers and dimers for the two cases. No significant difference (P > 0.1) was found for the total number of proteins measured. (C) Images of CHO-k1 cells expressing cytoplasmic mGFPs (mGFP-Cyto) and membrane-targeted mGFP (mGFP-Memb). Two images of the same cell are shown for the two different sample types at two heights in the z stack (0 and 3 μm). (D) Histogram representing the values of the best-fit ε on cells expressing mGFP on the membrane (2D) and cells expressing mGFP in the cytosol (3D). The experiments were performed on both living and fixed cells. For each bar, a minimum N = 20 was sampled. Error bars = SEM. Image size = 1,024 × 1,024 pixels. Pixel size = 0.092 μm. Step size in the z stack = 0.5 μm.

References

    1. Gurevich VV, Gurevich EV. GPCR monomers and oligomers: It takes all kinds. Trends Neurosci. 2008;31:74–81. - PMC - PubMed
    1. Magde D, Elson EL, Webb WW. Fluorescence correlation spectroscopy. II. An experimental realization. Biopolymers. 1974;13:29–61. - PubMed
    1. Chen Y, Müller JD, So PT, Gratton E. The photon counting histogram in fluorescence fluctuation spectroscopy. Biophys J. 1999;77:553–567. - PMC - PubMed
    1. Kask P, Palo K, Ullmann D, Gall K. Fluorescence-intensity distribution analysis and its application in biomolecular detection technology. Proc Natl Acad Sci USA. 1999;96:13756–13761. - PMC - PubMed
    1. Digman MA, et al. Measuring fast dynamics in solutions and cells with a laser scanning microscope. Biophys J. 2005;89:1317–1327. - PMC - PubMed

Publication types

Substances

LinkOut - more resources