. 2011 Apr 26;108(17):7016-21.
doi: 10.1073/pnas.1018280108. Epub 2011 Apr 11.

Quantification of receptor tyrosine kinase transactivation through direct dimerization and surface density measurements in single cells

Affiliations

Quantification of receptor tyrosine kinase transactivation through direct dimerization and surface density measurements in single cells

Jody L Swift et al. Proc Natl Acad Sci U S A. .

Abstract

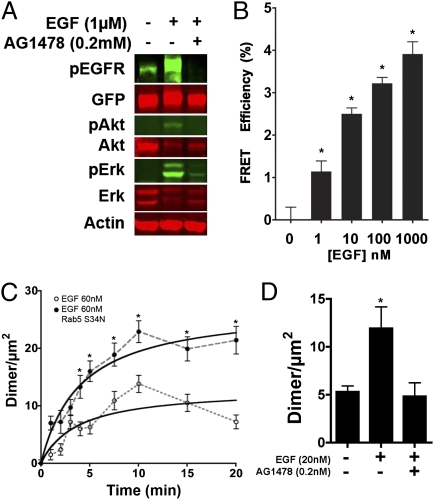
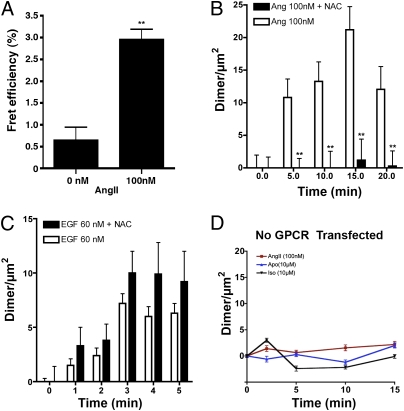
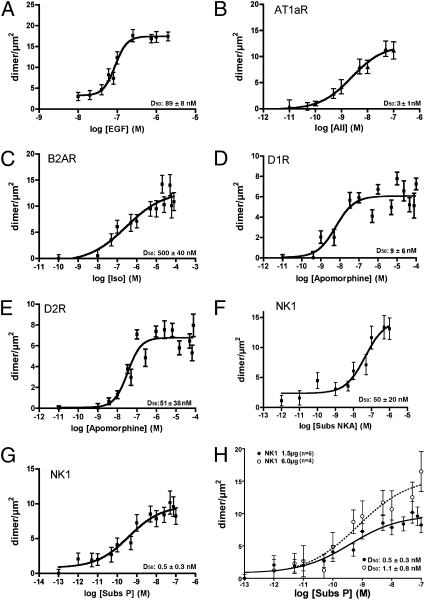
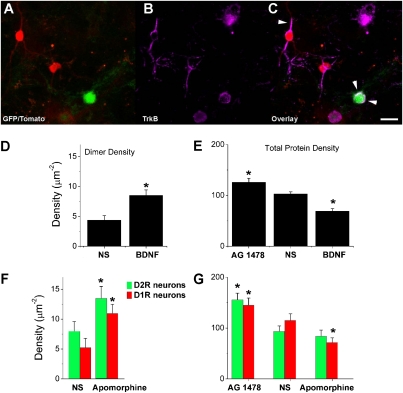
Cell signaling involves dynamic changes in protein oligomerization leading to the formation of different signaling complexes and modulation of activity. Spatial intensity distribution analysis (SpIDA) is an image analysis method that can directly measure oligomerization and trafficking of endogenous proteins in single cells. Here, we show the use of SpIDA to quantify dimerization/activation and surface transport of receptor protein kinases--EGF receptor and TrkB--at early stages of their transactivation by several G protein-coupled receptors (GPCRs). Transactivation occurred on the same timescale and was directly limited by GPCR activation but independent of G-protein coupling types. Early receptor protein kinase transactivation and internalization were not interdependent for all receptor pairs tested, revealing heterogeneity between groups of GPCRs. SpIDA also detected transactivation of TrkB by dopamine receptors in intact neurons. By allowing for time and space resolved quantification of protein populations with heterogeneous oligomeric states, SpIDA provides a unique approach to undertake single cell multivariate quantification of signaling processes involving changes in protein interactions, trafficking, and activity.


Conflict of interest statement

The authors declare no conflict of interest.

Figures

Fig. 1.
Fig. 1.
SpIDA allows the detection and quantification of EGFR in cells. (A) Representative Western blot showing EGF-induced phosphorylation of EGFR (Tyr1068), Akt (Ser473), and ERK1/2 (Thr202/Tyr204) in response to EGF with or without preincubation with the tyrosine kinase inhibitor AG1478 in EGFR-GFP CHO-k1 cells. For each phosphoprotein, the corresponding total protein was detected on the same membrane using primary antibodies and combinations of secondary antibodies labeled with different fluorescent dyes (IR-Dye 800 in green and IR-Dye-700 in red). (B) Detection of EGF-induced EGFR dimerization by FLIM/FRET in CHO-k1 cells coexpressing EGFR-GFP and EGFR-mCherry. Data are presented as percentage of FRET efficiency compared with basal signal obtained from nonstimulated cells (n = 42–70 cells from three independent experiments per conditions). (C) SpIDA analysis of EGFR dimer density over time after stimulation with EGF (60 nM) without (n = 25 cells/point) or with Rab5 S34N (n = 25 cells/point). Both datasets are from a single fixed cell experiment. (D) SpIDA analysis of EGFR dimer density at 5 min after stimulation with EGF (20 nM) with or without AG1478 (0.2 mM; n = 10, 5, and 8 cells/bar, respectively). Data are means ± SEM. *P ≤ 0.05 compared with unstimulated conditions (Mann–Whitney test).
Fig. 2.
Fig. 2.
Dimerization and endocytosis of EGFR in response to GPCR stimulation as detected by SpIDA. (A) Detection by FLIM/FRET of EGFR dimerization 1 min after stimulation with AngII (100 nM) in CHO-k1 cells coexpressing EGFR-GFP, EGFR-mCherry, and At1aR receptors. Data are presented as percentage of FRET efficiency compared with basal signal obtained from nonstimulated cells (n = 42–70 cells from three independent experiments per condition). (B) Effect of the transactivation inhibitor NAC on EGFR dimer density measured by SpIDA over time after stimulation with AngII (100 nM) in CHO-k1 cells coexpressing EGFR-GFP At1aR receptors in the presence (n = 4 cells/point) and absence of NAC (n = 17 cells/point). Both curves were obtained from a single live cell assay. (C) Comparison of EGFR dimerization under direct stimulation with 60 nM EGF in the presence (n = 25 cells/bar) and absence of NAC (n = 14 cells/bar). Both curves have the same temporal profile within error. (D) SpIDA detects no increase in dimer density in response to GPCR ligands Ang (100 nM) or Iso (10 μM) or the selective dopamine receptor agonist Apo (10 μM) in CHO-k1 cells expressing EGFR-GFP without additional GPCRs (n = 28 cells/point for all points). All data are means ± SEM. **P ≤ 0.01 (Mann–Whitney test) compared with unstimulated conditions (A) or NAC-treated condition at the same time point (B).
Fig. 3.
Fig. 3.
SpIDA allows the pharmacological characterization of EGFR transactivation by diverse GPCRs. (A) Dose-response curves of EGFR dimer density 1 min after direct stimulation by EGF in CHO-k1 cells (n = 111 cells/point from six individual titrations). (B–G) Dose-response curves of EGFR dimer density response 1 min after stimulation of GPCRs by (B) AngII (n = 125 cells/point), (C) Iso (n = 107 cells/point), (D and E) Apo (n = 322 cells/point for D2R and n = 260 cells/point for D1R, respectively), (F) SubsP (n = 120 cells/point), and (G) NKA (n = 134 cells/point) in CHO-k1 cells cotransfected with Rab5 S34N for either (B) At1aR, (C) B2AR, (D) D2R, (E) D1R, or (F and G) NK-1r (generated using six individual titrations). (H) Dose-response curves of EGFR dimer density 1 min poststimulation of either 1.5 (n = 120 cells/point from six individual titrations) or 6 μg (n = 60 cells/point from three individual titrations) of NK-1r by SubsP in CHO-k1 cells co-transfected with Rab5 S34N. Data are means ± SEM.
Fig. 4.
Fig. 4.
SpIDA allows for the detection and quantification of endogenous TrkB activation by endogenous dopamine receptors in striatal neurons. (A–C) Surface immunodetection of endogenous TrkB in striatal neurons prepared from BAC transgenic mice expressing a GFP (green) reporter gene in cells having endogenous D2R or a tomato (red) reporter gene in cells having endogenous D1R. Arrowheads in C indicate surface TrkB labeling on striatal neurons expressing different dopamine receptors. (Scale bar, 15 μm.) (D and E) SpIDA analysis of TrkB dimer (D) and surface densities (E) of neurons after incubation with AG1478 (0.2 mM for 30 min at 37 °C; n = 31 neurons) under nonstimulated condition (n = 93 neurons) and after direct stimulation with BDNF (50 pM for 3 min at 37 °C; n = 83 neurons). (F and G) SpIDA analysis of TrkB dimer (F) and surface densities (G) of neurons after incubation with AG1478 (0.2 mM for 30 min at 37 °C; D2R n = 30 neurons and D1R n = 33 neurons) under nonstimulated condition (D2R n = 19 neurons and D1R n = 26 neurons) and after stimulation of endogenous dopamine receptors with apomorphine (2 μM for 3 min at 37 °C; D2R n = 33 neurons and D1R n = 38 neurons). Data are presented for subpopulations of striatal neurons expressing D1R or D2R. All data are means ± SEM. *P ≤ 0.05 (Mann–Whitney test).

References

    1. Lemmon MA, Schlessinger J. Cell signaling by receptor tyrosine kinases. Cell. 2010;141:1117–1134. - PMC - PubMed
    1. Maudsley S, et al. The beta(2)-adrenergic receptor mediates extracellular signal-regulated kinase activation via assembly of a multi-receptor complex with the epidermal growth factor receptor. J Biol Chem. 2000;275:9572–9580. - PubMed
    1. Eguchi S, et al. Calcium-dependent epidermal growth factor receptor transactivation mediates the angiotensin II-induced mitogen-activated protein kinase activation in vascular smooth muscle cells. J Biol Chem. 1998;273:8890–8896. - PubMed
    1. Rajagopal R, Chen ZY, Lee FS, Chao MV. Transactivation of Trk neurotrophin receptors by G-protein-coupled receptor ligands occurs on intracellular membranes. J Neurosci. 2004;24:6650–6658. - PMC - PubMed
    1. Godin AG, et al. Revealing protein oligomerization and densities in situ using spatial intensity distribution analysis. Proc Natl Acad Sci USA. 2011;108:7010–7015. - PMC - PubMed

Publication types