

Motion of myosin head domains during activation and force development in skeletal muscle
- PMID: 21482782
- PMCID: PMC3084075
- DOI: 10.1073/pnas.1018330108
Motion of myosin head domains during activation and force development in skeletal muscle
Abstract
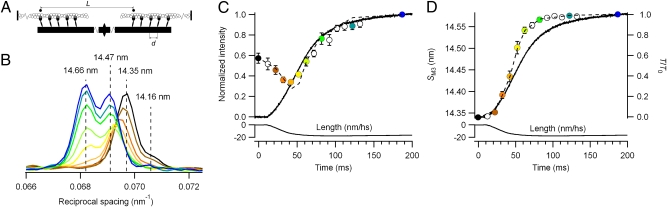
Muscle contraction is driven by a change in the structure of the head domain of myosin, the "working stroke" that pulls the actin filaments toward the midpoint of the myosin filaments. This movement of the myosin heads can be measured very precisely in intact muscle cells by X-ray interference, but until now this technique has not been applied to physiological activation and force generation following electrical stimulation of muscle cells. By using this approach, we show that the long axes of the myosin head domains are roughly parallel to the filaments in resting muscle, with their center of mass offset by approximately 7 nm from the C terminus of the head domain. The observed mass distribution matches that seen in electron micrographs of isolated myosin filaments in which the heads are folded back toward the filament midpoint. Following electrical stimulation, the heads move by approximately 10 nm away from the filament midpoint, in the opposite direction to the working stroke. The time course of this motion matches that of force generation, but is slower than the other structural changes in the myosin filaments on activation, including the loss of helical and axial order of the myosin heads and the change in periodicity of the filament backbone. The rate of force development is limited by that of attachment of myosin heads to actin in a conformation that is the same as that during steady-state isometric contraction; force generation in the actin-attached head is fast compared with the attachment step.
Conflict of interest statement
The authors declare no conflict of interest.
Figures


References
-
- Huxley HE. The mechanism of muscular contraction. Science. 1969;164:1356–1365. - PubMed
-
- Huxley AF, Simmons RM. Proposed mechanism of force generation in striated muscle. Nature. 1971;233:533–538. - PubMed
-
- Lymn RW, Taylor EW. Mechanism of adenosine triphosphate hydrolysis by actomyosin. Biochemistry. 1971;10:4617–4624. - PubMed
-
- Rayment I, et al. Three-dimensional structure of myosin subfragment-1: A molecular motor. Science. 1993;261:50–58. - PubMed
-
- Rayment I, et al. Structure of the actin-myosin complex and its implications for muscle contraction. Science. 1993;261:58–65. - PubMed
Publication types
MeSH terms
Substances
Grants and funding
LinkOut - more resources
Full Text Sources
