. 2011 Apr 26;108(17):6817-22.
doi: 10.1073/pnas.1015024108. Epub 2011 Apr 11.

Quantifying structure and performance diversity for sets of small molecules comprising small-molecule screening collections

Affiliations

Quantifying structure and performance diversity for sets of small molecules comprising small-molecule screening collections

Paul A Clemons et al. Proc Natl Acad Sci U S A. .

Abstract

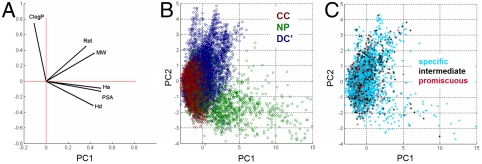
Using a diverse collection of small molecules we recently found that compound sets from different sources (commercial; academic; natural) have different protein-binding behaviors, and these behaviors correlate with trends in stereochemical complexity for these compound sets. These results lend insight into structural features that synthetic chemists might target when synthesizing screening collections for biological discovery. We report extensive characterization of structural properties and diversity of biological performance for these compounds and expand comparative analyses to include physicochemical properties and three-dimensional shapes of predicted conformers. The results highlight additional similarities and differences between the sets, but also the dependence of such comparisons on the choice of molecular descriptors. Using a protein-binding dataset, we introduce an information-theoretic measure to assess diversity of performance with a constraint on specificity. Rather than relying on finding individual active compounds, this measure allows rational judgment of compound subsets as groups. We also apply this measure to publicly available data from ChemBank for the same compound sets across a diverse group of functional assays. We find that performance diversity of compound sets is relatively stable across a range of property values as judged by this measure, both in protein-binding studies and functional assays. Because building screening collections with improved performance depends on efficient use of synthetic organic chemistry resources, these studies illustrate an important quantitative framework to help prioritize choices made in building such collections.


Conflict of interest statement

The authors declare no conflict of interest.

Figures

Fig. 1.
Fig. 1.
DC′ occupies a distinct part of the property space from CC and NP. (A) Scatterplot of MW versus cLogP, omitting three compounds (all from NP) with MW > 1,500 and three compounds (all from DC′) with cLogP > 15. (B) Top three principal components (PCs) (93% of total variance) using six properties. (c) PC1 versus PC3, illustrating dimension in which DC′ is similar to NP. (D) PC2 versus PC3, illustrating dimension in which DC′ is distinct from NP (CC: dark red; NP: dark green; DC′: dark blue).
Fig. 2.
Fig. 2.
Specific binders occur throughout the property space. (A) PCA coefficient map of six properties onto first two PCs, showing correlations between properties and interpretation of dimensions; horizontal and vertical scales are relative to unit vectors along the PCs. (B) PC1 versus PC2 showing compound sets (CC: dark red; NP: dark green; DC′: dark blue); scales are unit standard deviations. (C) PC1 versus PC2 showing distributions of protein-binding specificity groups (cf. figure 7 of ref. 48); (specific: 1 protein, cyan; intermediate: 2–5 proteins, black; promiscuous: 6 + proteins, red); scales are the same as in B. Promiscuous compounds are significantly concentrated (p < 0.0099) in the center of the space.
Fig. 3.
Fig. 3.
Different chemical spaces provide intuitive comparisons between collections. (A) PCA coefficient map of select atom counts onto first two PCs, showing interpretation of PCA dimensions. (B) PC1 versus PC2 showing compound sets in the space of A (CC: dark red; NP: dark green; DC′: dark blue). (C) PCA coefficient map of select ring and chain counts onto first two PCs, showing interpretation of PCA dimensions. (D) PC1 versus PC2 showing compound sets in the space of C. (E) PCA coefficient map of E-state sums (54) (reporting electronic environments of different carbon atom types) onto first two PCs, showing interpretation of PCA dimensions (s: single bond; d: double bond; a: aromatic bond). (F) PC1 versus PC2 showing compound sets in the space of E. Scale units for coefficient maps and PCA plots are the same as Fig. 2.
Fig. 4.
Fig. 4.
Different compound sets and specificity groups are quantitatively different in shape distributions. (A) PMI maps showing compounds from each set (Top; CC: dark red; NP: dark green; DC′: dark blue) and from each specificity group (specific: 1 protein, cyan; intermediate: 2–5 proteins, black; promiscuous: 6 + proteins, red). Canonical PMI shapes are shown on the bottom-left map. (B) Cumulative distributions of distances from canonical sphere shape using PMI descriptors. (C) Cumulative distributions of distances from canonical flat shape using alpha-shape descriptors (29). Color-coding of distributions is the same as in A.
Fig. 5.
Fig. 5.
Shannon entropy measures performance diversity for sets of compounds across many assays. (A) Performance diversity of CC, NP, and DC′ in 100 protein-binding assays, including profile entropy for all compounds (red bars), hits only (black bars), and weighted profile entropy (cyan bars). (B) Performance diversity of CC, NP, and DC′ in ChemBank assay data; color coding is the same as A. (c) Trend lines in relative performance diversity for all compounds in protein-binding assays as a function of increasing ranked cLogP values, including both profile entropy (black line) and weighted profile entropy (cyan line). (D) Trend lines in relative performance diversity for all compounds in ChemBank functional assays as a function of increasing ranked cLogP (solid lines) or MW (dashed lines) values, including both profile entropies (black) and weighted profile entropies (cyan). In C and D, entropy values are normalized by subtraction to the first compound set considered (i.e., lowest values of cLogP or MW).

Similar articles

Cited by

References

    1. Iwasa J, Fujita T, Hansch C. Substituent constants for aliphatic functions obtained from partition coefficients. J Med Chem. 1965;8:150–153. - PubMed
    1. Fujita T, Hansch C. Analysis of the structure-activity relationship of the sulfonamide drugs using substituent constants. J Med Chem. 1967;10:991–1000. - PubMed
    1. Hansch C. A quantitative approach to biochemical structure-activity relationships. Acc Chem Res. 1969;2:232–239.
    1. Clemons PA. Chemical Informatics. In: Schreiber SL, Kapoor TM, Wess G, editors. Chemical Biology: From Small Molecules to Systems Biology and Drug Design. Vol 2. Weinheim Germany: Wiley-VCH; 2007. pp. 723–759.
    1. Drewry DH, Macarron R. Enhancements of screening collections to address areas of unmet medical need: An industry perspective. Curr Opin Chem Biol. 2010;14:289–298. - PubMed

Publication types

MeSH terms

LinkOut - more resources