. 2011 Jun 10;286(23):20797-811.
doi: 10.1074/jbc.M111.234674. Epub 2011 Apr 11.

Amyloid beta-mediated cell death of cultured hippocampal neurons reveals extensive Tau fragmentation without increased full-length tau phosphorylation

Affiliations

Amyloid beta-mediated cell death of cultured hippocampal neurons reveals extensive Tau fragmentation without increased full-length tau phosphorylation

Jack Reifert et al. J Biol Chem. .

Abstract

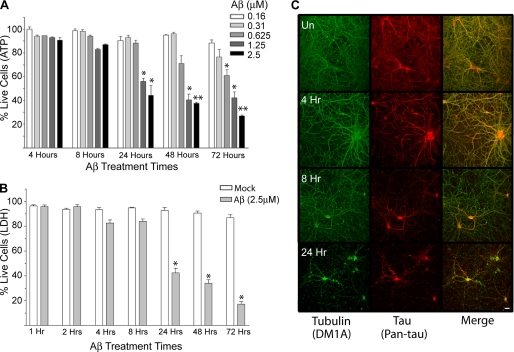
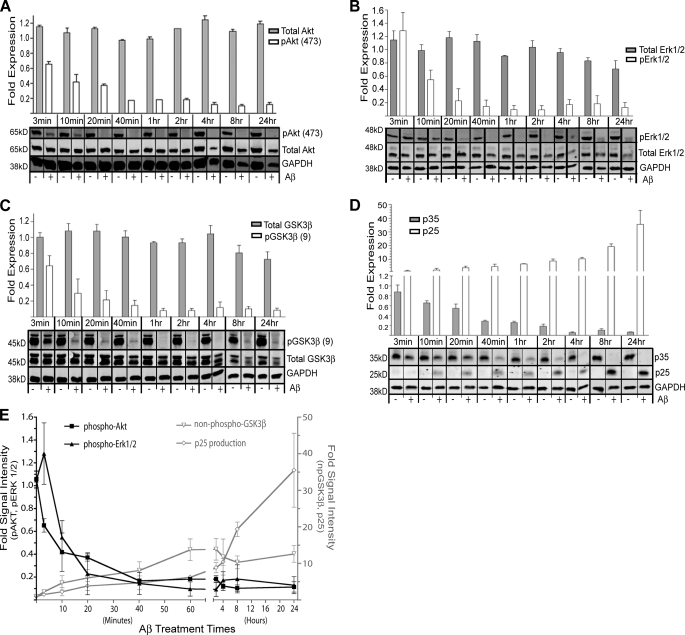
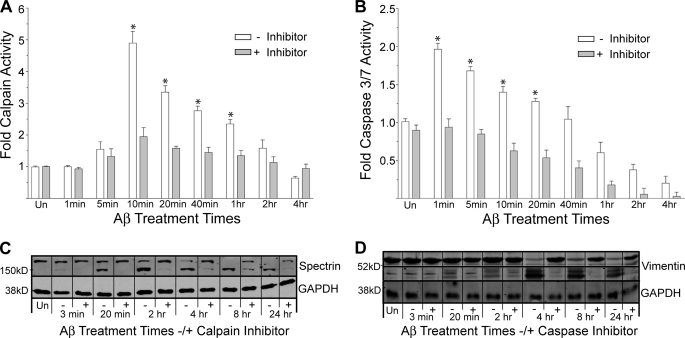
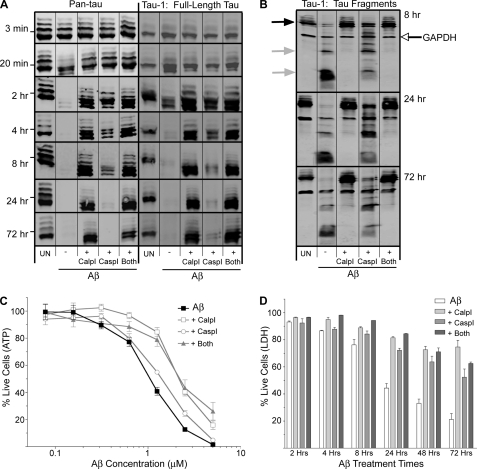
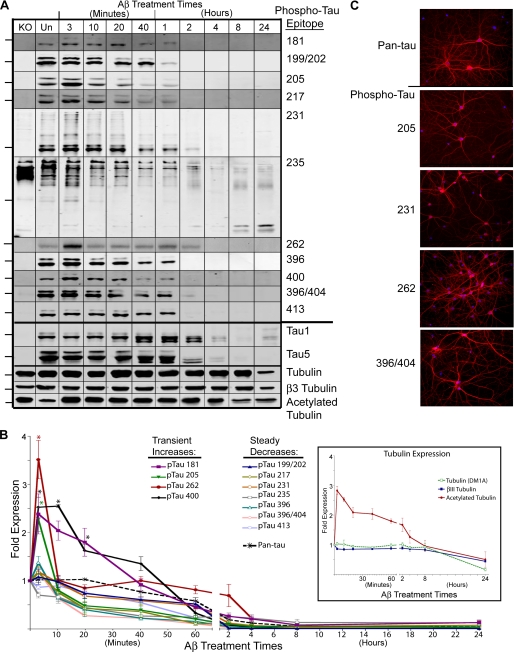
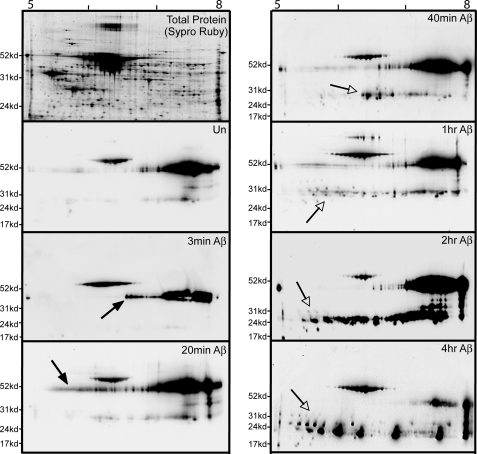
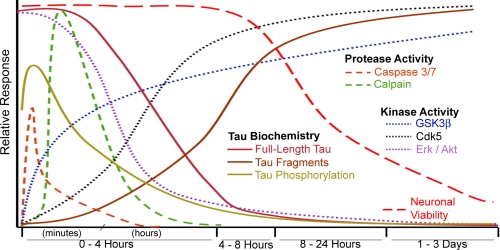
A variety of genetic and biochemical evidence suggests that amyloid β (Aβ) oligomers promote downstream errors in Tau action, in turn inducing neuronal dysfunction and cell death in Alzheimer and related dementias. To better understand molecular mechanisms involved in Aβ-mediated neuronal cell death, we have treated primary rat hippocampal cultures with Aβ oligomers and examined the resulting cellular changes occurring before and during the induction of cell death with a focus on altered Tau biochemistry. The most rapid neuronal responses upon Aβ administration are activation of caspase 3/7 and calpain proteases. Aβ also appears to reduce Akt and Erk1/2 kinase activities while increasing GSK3β and Cdk5 activities. Shortly thereafter, substantial Tau degradation begins, generating relatively stable Tau fragments. Only a very small fraction of full-length Tau remains intact after 4 h of Aβ treatment. In conflict with expectations based on suggested increases of GSK3β and Cdk5 activities, Aβ does not cause any major increases in phosphorylation of full-length Tau as assayed by immunoblotting one-dimensional gels with 11 independent site- and phospho-specific anti-Tau antibodies as well as by immunoblotting two-dimensional gels probed with a pan-Tau antibody. There are, however, subtle and transient increases in Tau phosphorylation at 3-4 specific sites before its degradation. Taken together, these data are consistent with the notion that Aβ-mediated neuronal cell death involves the loss of full-length Tau and/or the generation of toxic fragments but does not involve or require hyperphosphorylation of full-length Tau.


Figures

FIGURE 1.
FIGURE 1.
Extensive neuronal cell death occurs between 8 and 24 h after Aβ administration. A, shown is cell viability as measured by ATP content in hippocampal neuronal cultures treated with the indicated concentrations of Aβ as a function of time. 2.5 μm Aβ produces ∼50% cell death after 24 h of exposure. Error bars represent S.E. of three independent experiments. B, shown is cell viability as measured by LDH released into the media when hippocampal neurons are treated with 2.5 μm Aβ for the indicated times. Error bars represent S.E. of at least three independent experiments. C, shown is immunofluorescence microscopy images of hippocampal neurons treated with 2.5 μm Aβ for the indicated times. Anti-Tau (pan-Tau) is red, and anti-α-tubulin (DM1A) is green. Magnification, 20×; scale bar, 10 μm. *, p < 0.05; **, p < 0.01 compared with controls. UN, untreated.
FIGURE 2.
FIGURE 2.
Aβ treatment promotes biochemical changes, suggesting inactivation of Akt and Erk1/2 and activation of Tau-targeting kinases GSK3β and Cdk5. A, shown are immunoblots of the survival kinase Akt and its activated form, phospho-Akt at serine 473 (pAkt (473)). B, shown are immunoblots of Erk1/2 and its activated form, phospho-Erk1/2. C, shown are immunoblots of GSK3β and an inactivated form, phospho-GSK3β, at serine 9 (pGSK3β (9)). D, shown are immunoblots of p35 and the production of its proteolytic fragment, p25 (an activator of Cdk5). Panels A–D graphically present densitometry analysis (above) of the respective protein levels determined by immunoblotting (below). For each time point we first normalize the GAPDH data from the untreated (−) and treated (+) samples. Using this correction factor, we then ratio the Aβ treated versus untreated signals for each band of interest to generate the -fold intensity of each treated time point (shown in the bar graphs). Error bars represent S.E. of densitometry from three independent experiments. E, shown is a graphic summary of the data in A–D. Cdk5 activity is suggested by p25 fragment production. Non-phospho-GSK3β (npGSK3β) indicates the loss of signal for phospho-GSK3β at serine 9, suggesting activation of this kinase. Kinases in black are graphed against the left y axis, whereas kinases in gray are graphed against the right y axis. Note that the x axis is non-linear. Error bars represent S.E. of densitometry from 3 independent experiments.
FIGURE 3.
FIGURE 3.
Aβ induces rapid activation of caspase 3/7 and calpain proteases. A and B, direct activity measurements were performed as described under “Experimental Procedures” as a function of time exposed to Aβ without (−) or with (+) the respective protease inhibitor pretreatment. Data were normalized to 1 for mock-treated controls (Un). Error bars represent the S.E. of three independent experiments. *, p < 0.01 compared with controls. C and D, an immunoblot analysis verifies protease activity with substrate cleavage. Calpain substrate spectrin and caspase substrate vimentin demonstrate cleavage into smaller molecular weight fragments upon Aβ treatment, both of which are protected by the respective inhibitors.
FIGURE 4.
FIGURE 4.
Aβ induces rapid Tau degradation and the production of relatively stable low molecular weight fragments. A, full-length Tau immunoblots were detected using the pan-Tau antibody. The GAPDH housekeeping signal is shown below. B, Tau-5 immunoblot highlights the fragmentation pattern and accumulation of low molecular weight Tau fragments. C, the Tau-1 blot corroborates the generation of low molecular weight Tau fragments along with a Coomassie Blue stained gel, demonstrating protein integrity and lack of general degradation. The line graph shown in D presents the loss of full-length Tau as a function of time exposed to Aβ (graphed against the left y axis) and the production of the 24- and 17-kDa Tau fragments (graphed against the right y axis). Note that the x axis is non-linear.
FIGURE 5.
FIGURE 5.
Calpain and caspase protease inhibitors differentially protect against Tau degradation as well as Aβ-mediated cell death. A, Pan-Tau and Tau-1 immunoblots after Aβ treatment between 3 min and 72 h. Marks to the left of the immunoblots indicate the 53-kDa size standard. B, Tau-1 immunoblots 8, 24, and 72 h after Aβ treatment show Tau fragmentation into 24- and 17-kDa products (gray arrows). Full-length Tau (black arrow) and GAPDH signals (open arrow) are indicated. C, cell viability was measured by ATP content after 72 h of treatment of a dose titration of Aβ. The graph is representative of data from two independent experiments. Error bars represent S.E. of replicate wells. D, cell viability was measured by LDH release after treatment with 2.5 μm Aβ for the indicated times. Error bars represent S.E. from at least two independent experiments. A–D, UN, untreated samples; Aβ −, Aβ without any inhibitor treatment; Aβ + CalpI, Aβ with calpain inhibitor treatment; Aβ + CaspI, Aβ with caspase inhibitor treatment; Aβ + Both, Aβ with both calpain and caspase inhibitor treatment.
FIGURE 6.
FIGURE 6.
Aβ does not induce sustained increases in Tau phosphorylation at 11 single or double epitopes analyzed. A, shown are immunoblots of Aβ-treated hippocampal neuronal lysates probed for 11 different phospho and site-specific Tau antibodies as well as Tau-1, Tau-5 and tubulin antibodies. Marks to the left of the immunoblots indicate the 53-kDa size standard. KO, lysates from Tau knock-out mouse brain. Un, untreated samples. B, shown is quantitative analysis of the phospho-Tau immunoblots in A, with untreated samples for each time-course set to 1. The inset graph displays analysis for total, βIII, and acetylated tubulin immunoblots. Error bars represent S.E. for three independent experiments. *, p < 0.05 compared with untreated control. C, immunofluorescence microscopy of untreated neurons stained for pan-Tau and the phospho-Tau antibodies indicated is shown. The Tau stain is red, whereas the nuclear stain is blue. Magnification, 20×.
FIGURE 7.
FIGURE 7.
Two-dimensional immunoblotting demonstrates that Aβ treatment does not induce sustained acidic shifts in Tau isoelectric points as would be predicted from hyperphosphorylation. Shown are two-dimensional anti-Tau immunoblots (using anti-pan-Tau) on a time-course of Aβ-treated neuronal lysates first separated by pI between 5 and 8 and then separated by molecular weight. At the top left is a Sypro Ruby-stained gel of a control neuronal cell lysate, demonstrating good separation and resolution of total cellular proteins. An untreated (Un) blot defines the two-dimensional pattern of control Tau. Additional blots correspond to the designated time in the presence of Aβ. Solid arrows point to a small subset of Tau exhibiting an acidic pI shift at 3- and 20-min time points; however, this signal is no longer present at later times. Open arrows point to the prominent accumulation of low molecular weight Tau fragments starting after 40 min of Aβ treatment and accumulating through 4 h of treatment.
FIGURE 8.
FIGURE 8.
Timeline summary of observed events on Aβ-treated hippocampal neurons. The earliest events we observed were activation of caspase and calpain proteases, which display maximal activity within 20 min of Aβ treatment and return to normal levels by 4 h. Erk1/2 and Akt activities are depleted within 30 min to 1 h of Aβ treatment. GSK3β and Cdk5 activation also occurred rapidly and remained elevated throughout the entire time-course. These events precede and overlap with changes in Tau biochemistry, loss of full-length Tau, and accumulation of 17- and 24-kDa Tau fragments. The surprising lack of sustained Tau phosphorylation is depicted as an early spike (phosphorylated epitopes 181, 205, 262, and 400) and subsequent reduction. Events observed that are not depicted in this figure include reduced tubulin immunofluorescence between 8 and 24 h and the rapid and sustained increase in tubulin acetylation after Aβ treatment.

References

    1. Ballatore C., Lee V. M., Trojanowski J. Q. (2007) Nat. Rev. Neurosci. 8, 663–672 - PubMed
    1. Buée L., Delacourte A. (1999) Brain Pathol. 9, 681–693 - PMC - PubMed
    1. Haass C., Selkoe D. J. (2007) Nat. Rev. Mol. Cell Biol. 8, 101–112 - PubMed
    1. Beyreuther K., Bush A. I., Dyrks T., Hilbich C., König G., Mönning U., Multhaup G., Prior R., Rumble B., Schubert W., et al. (1991) Ann. N.Y. Acad. Sci. 640, 129–139 - PubMed
    1. Tanzi R. E., Bertram L. (2005) Cell 120, 545–555 - PubMed

Publication types

MeSH terms

Substances