

Cancer burden in the HIV-infected population in the United States
- PMID: 21483021
- PMCID: PMC3086877
- DOI: 10.1093/jnci/djr076
Cancer burden in the HIV-infected population in the United States
Abstract
Background: Effective antiretroviral therapy has reduced the risk of AIDS and dramatically prolonged the survival of HIV-infected people in the United States. Consequently, an increasing number of HIV-infected people are at risk of non-AIDS-defining cancers that typically occur at older ages. We estimated the annual number of cancers in the HIV-infected population, both with and without AIDS, in the United States.
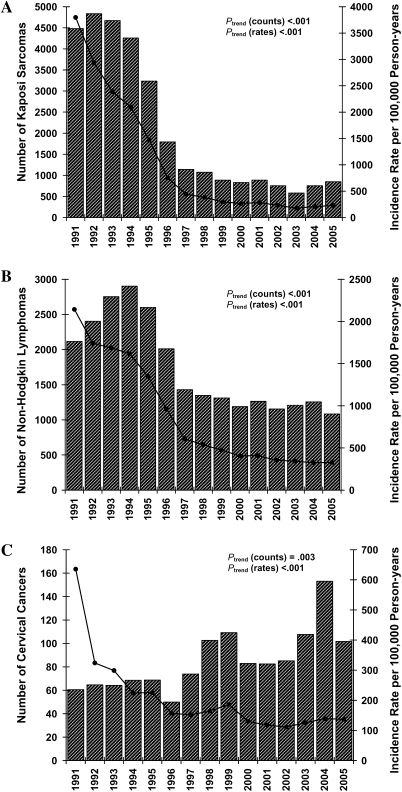
Methods: Incidence rates for individual cancer types were obtained from the HIV/AIDS Cancer Match Study by linking 15 HIV and cancer registries in the United States. Estimated counts of the US HIV-infected and AIDS populations were obtained from Centers for Disease Control and Prevention surveillance data. We obtained estimated counts of AIDS-defining (ie, Kaposi sarcoma, non-Hodgkin lymphoma, and cervical cancer) and non-AIDS-defining cancers in the US AIDS population during 1991-2005 by multiplying cancer incidence rates and AIDS population counts, stratified by year, age, sex, race and ethnicity, transmission category, and AIDS-relative time. We tested trends in counts and standardized incidence rates using linear regression models. We multiplied overall cancer rates and HIV-only (HIV infected, without AIDS) population counts, available from 34 US states during 2004-2007, to estimate cancers in the HIV-only population. All statistical tests were two-sided.
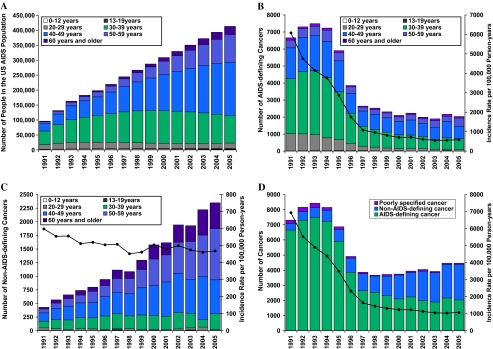
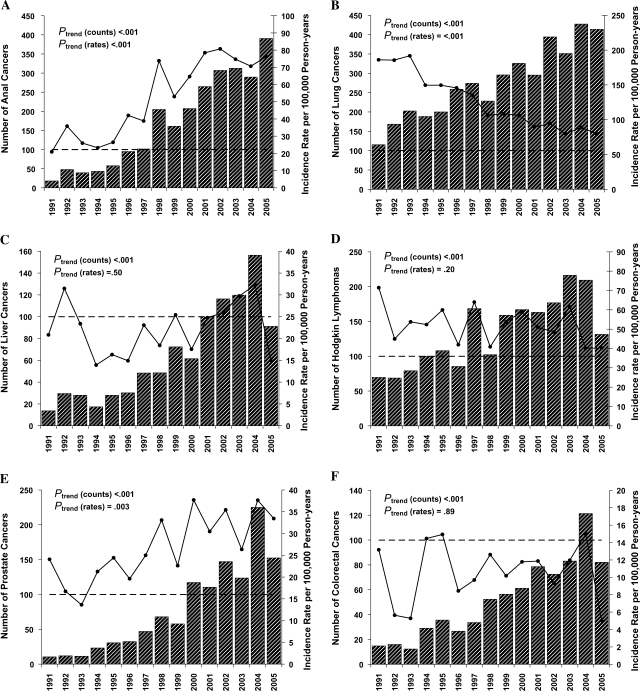
Results: The US AIDS population expanded fourfold from 1991 to 2005 (96,179 to 413,080) largely because of an increase in the number of people aged 40 years or older. During 1991-2005, an estimated 79 656 cancers occurred in the AIDS population. From 1991-1995 to 2001-2005, the estimated number of AIDS-defining cancers decreased by greater than threefold (34,587 to 10,325 cancers; P(trend) < .001), whereas non-AIDS-defining cancers increased by approximately threefold (3193 to 10,059 cancers; P(trend) < .001). From 1991-1995 to 2001-2005, estimated counts increased for anal (206 to 1564 cancers), liver (116 to 583 cancers), prostate (87 to 759 cancers), and lung cancers (875 to 1882 cancers), and Hodgkin lymphoma (426 to 897 cancers). In the HIV-only population in 34 US states, an estimated 2191 non-AIDS-defining cancers occurred during 2004-2007, including 454 lung, 166 breast, and 154 anal cancers.
Conclusions: Over a 15-year period (1991-2005), increases in non-AIDS-defining cancers were mainly driven by growth and aging of the AIDS population. This growing burden requires targeted cancer prevention and treatment strategies.
Figures
References
-
- Engels EA, Pfeiffer RM, Goedert JJ, et al. Trends in cancer risk among people with AIDS in the United States 1980-2002. AIDS. 2006;20(12):1645–1654. - PubMed
-
- Engels EA, Biggar RJ, Hall HI, et al. Cancer risk in people infected with human immunodeficiency virus in the United States. Int J Cancer. 2008;123(1):187–194. - PubMed
-
- Patel P, Hanson DL, Sullivan PS, et al. Incidence of types of cancer among HIV-infected persons compared with the general population in the United States, 1992-2003. Ann Intern Med. 2008;148(10):728–736. - PubMed
Publication types
MeSH terms
Grants and funding
LinkOut - more resources
Full Text Sources
Other Literature Sources
Medical
