. 2011 Mar;7(3):e1001116.
doi: 10.1371/journal.pcbi.1001116. Epub 2011 Mar 31.

Reconciliation of genome-scale metabolic reconstructions for comparative systems analysis

Affiliations

Reconciliation of genome-scale metabolic reconstructions for comparative systems analysis

Matthew A Oberhardt et al. PLoS Comput Biol. 2011 Mar.

Abstract

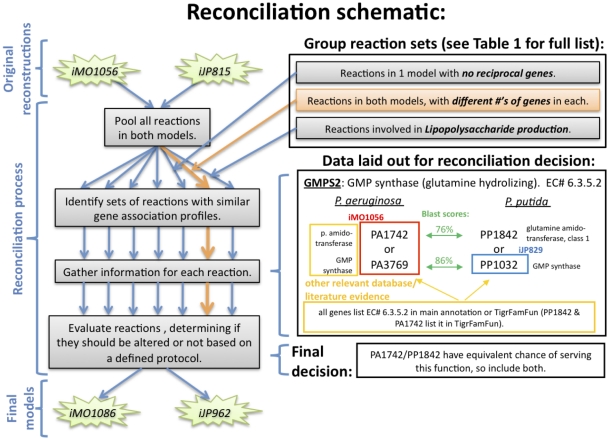
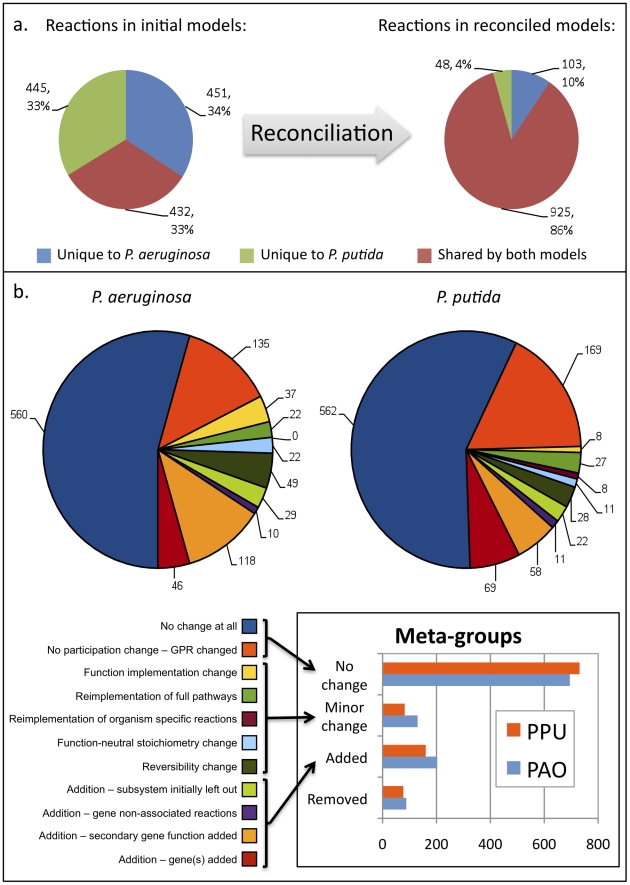
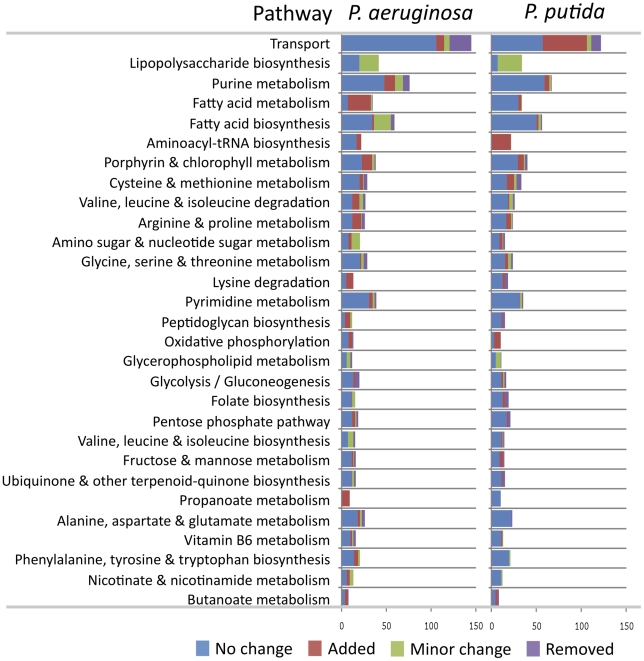
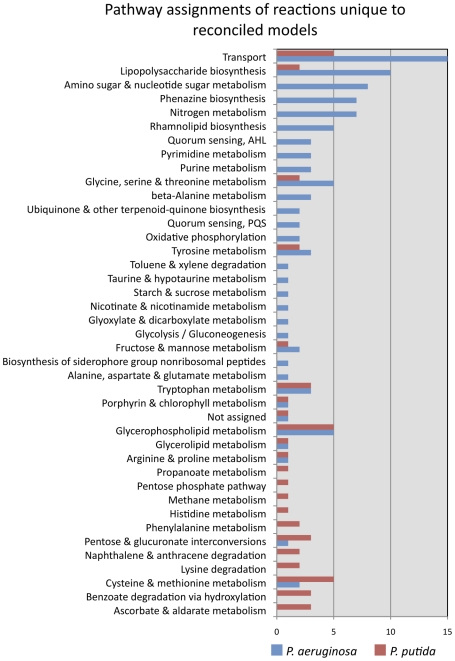
In the past decade, over 50 genome-scale metabolic reconstructions have been built for a variety of single- and multi- cellular organisms. These reconstructions have enabled a host of computational methods to be leveraged for systems-analysis of metabolism, leading to greater understanding of observed phenotypes. These methods have been sparsely applied to comparisons between multiple organisms, however, due mainly to the existence of differences between reconstructions that are inherited from the respective reconstruction processes of the organisms to be compared. To circumvent this obstacle, we developed a novel process, termed metabolic network reconciliation, whereby non-biological differences are removed from genome-scale reconstructions while keeping the reconstructions as true as possible to the underlying biological data on which they are based. This process was applied to two organisms of great importance to disease and biotechnological applications, Pseudomonas aeruginosa and Pseudomonas putida, respectively. The result is a pair of revised genome-scale reconstructions for these organisms that can be analyzed at a systems level with confidence that differences are indicative of true biological differences (to the degree that is currently known), rather than artifacts of the reconstruction process. The reconstructions were re-validated with various experimental data after reconciliation. With the reconciled and validated reconstructions, we performed a genome-wide comparison of metabolic flexibility between P. aeruginosa and P. putida that generated significant new insight into the underlying biology of these important organisms. Through this work, we provide a novel methodology for reconciling models, present new genome-scale reconstructions of P. aeruginosa and P. putida that can be directly compared at a network level, and perform a network-wide comparison of the two species. These reconstructions provide fresh insights into the metabolic similarities and differences between these important Pseudomonads, and pave the way towards full comparative analysis of genome-scale metabolic reconstructions of multiple species.


Conflict of interest statement

The authors have declared that no competing interests exist.

Figures

Figure 1
Figure 1. Format of reconciliation process.
The reconciliation information for the reaction GMP synthase is shown. In the center are boxes showing the genes included in the original reconstructions, iMO1056 (P. aeruginosa) and iJP815 (P. putida). Reciprocal gene matches based on the genome-wide BLAST study are shown in the center with two-headed arrows. Auxiliary information about the genes is displayed on the left and right margins. Finally, the bottom box shows the final decision that was made for this reaction, based on the available information.
Figure 2
Figure 2. Reconciliation results.
This figure highlights statistics of the reaction participation in both the P. aeruginosa and P. putida reconstructions before and after reconciliation, as well as the reasons for adding or removing reactions to the reconstructions. Panel (a) shows the numbers of reactions from both initial reconstructions that are unique to the two organisms versus shared between the reconstructions (left), and the reaction participation following reconciliation (right). Panel (b) shows the reasons for changing reactions in both reconstructions. These reasons for changing reactions are then grouped into broader ‘meta-groups’, as shown in the inset plot. In panel (b), the colors for the categories and the pie charts are correlated.
Figure 3
Figure 3. Changes to reconstructions by pathway.
The changes made to the P. putida and P. aeruginosa reconstructions during reconciliation are split into the four ‘meta-groups’ described in Figure 2 , and listed by pathway. Only pathways with at least eight reactions changed (as a sum of changes in both reconstructions) are listed, and pathways are ranked by the aggregate number of reactions changed during reconciliation.
Figure 4
Figure 4. Pathways unique to the reconciled reconstructions.
All pathways for which some reactions are present in the reconciled P. aeruginosa reconstruction but not the P. putida reconstruction, or vice versa, are listed. The size of the bars corresponds to the number of unique reactions in P. aeruginosa (red) or P. putida (blue).
Figure 5
Figure 5. BIOLOG validation of reconciled reconstructions.
Substrate utilization results are listed for iMO1086 and iJP962. In vitro results from BIOLOG studies of the two organisms are compared to pre- and post- reconciliation network predictions of viability of P. aeruginosa and P. putida on minimal media with the listed substrate as sole carbon source. The top section of the table includes substrates that are represented in at least one of the metabolic reconstructions (pre- or post- reconciliation GENRE of either organism), and the bottom section includes the remaining substrates assessed in the BIOLOG assay. Substrate utilization is indicated by a box being shaded in, whereas non-utilization is indicated with an X.
Figure 6
Figure 6. Reconciliation-derived changes in essential reactions.
Reactions that are essential in the reconciled models for optimal (outer circles) or any (inner circles) growth were determined in in silico glucose medium. The numbers of these reactions belonging to the no change, added, and minor change categories (from the reconciliation) are indicated in the donut charts.
Figure 7
Figure 7. Analysis of tradeoffs in producing virulence factor precursors.
Differences were analyzed between P. aeruginosa and P. putida in their flexibility in tradeoffs between all pairs of 19 virulence factor precursors (plus the biomass reaction). This analysis was done by constructing pareto optimum curves, as described in Materials and Methods. Panel (a) lists the 19 precursor metabolites, along with the virulence factors for which they are precursors. Panel (b) shows the virulence precursor tradeoff curve that most differs between P. aeruginosa and P. putida. Units refer to feasible flux values through demand reactions for the given virulence precursor in units of (mmol)·gDW−1·h−1 given a specific glucose uptake rate of 10 (mmol glc)·gDW−1·h−1. The percentage by which the areas of these curves differ between iMO1086 and iJP962 is shown in the top right of the plot (with the ‘-’ value indicating a greater area (i.e., greater flexibility) in P. putida than in P. aeruginosa. Panel (c) shows a histogram of all of the reaction pairings, binned based on the percentage difference in flexibility between P. aeruginosa and P. putida.
Figure 8
Figure 8. Metabolic flexibility of pathway pairs in PAO and PPU.
In panel (a) Each pixel represents a pair of pathways in the reconciled models of P. aeruginosa (PAO) and P. putida (PPU). For each pathway pair, boundary curves for feasible flux tradeoffs were plotted for 20 random pairs of reactions belonging to the two pathways (or 10 pairs for pathways paired with themselves). The area within these feasible flux bounds was calculated in both models for each reaction pair. Then, a statistical test was used to determine whether PAO or PPU had a significantly larger area in the set of reaction pairs representing the given pathway pair. The degree to which PAO or PPU showed a larger area for a given pathway pair is marked by pixel color, as shown in the legend. Blue pixels denote pathway pairs that do not meet the significance cutoff, i.e., for which different reaction pairs behaved inconsistently within the pathway pair. A larger area in a given organism can be interpreted as a higher metabolic flexibility with regards to tradeoffs between the reaction/pathway pairs. Panel (b) lists features of the pathways with the most flexibility in PAO and PPU, as derived from the plot in panel (a). (*) The number of reactions in each pathway is listed after the name of the pathway in (a), and in the ‘# rxns in pathway’ column of (b). Only reactions that are both (1) in both models and (2) that can carry flux in at least 1 model are included in this figure.

Similar articles

Cited by

References

    1. Feist AM, Herrgard MJ, Thiele I, Reed JL, Palsson BO. Reconstruction of biochemical networks in microorganisms. Nat Rev Microbiol. 2009;7:129–143. - PMC - PubMed
    1. Oberhardt MA, Palsson BO, Papin JA. Applications of genome-scale metabolic reconstructions. Mol Syst Biol. 2009;5:320. - PMC - PubMed
    1. Thiele I, Palsson BO. A protocol for generating a high-quality genome-scale metabolic reconstruction. Nat Protoc. 2010;5:93–121. - PMC - PubMed
    1. Thiele I, Palsson BO. Reconstruction annotation jamborees: a community approach to systems biology. Mol Syst Biol. 2010;6:361. - PMC - PubMed
    1. Murray TS, Egan M, Kazmierczak BI. Pseudomonas aeruginosa chronic colonization in cystic fibrosis patients. Curr Opin Pediatr. 2007;19:83–88. - PubMed

Publication types

LinkOut - more resources