. 2011 Mar;7(3):e1001329.
doi: 10.1371/journal.ppat.1001329. Epub 2011 Mar 31.

Dissection of the influenza A virus endocytic routes reveals macropinocytosis as an alternative entry pathway

Affiliations

Dissection of the influenza A virus endocytic routes reveals macropinocytosis as an alternative entry pathway

Erik de Vries et al. PLoS Pathog. 2011 Mar.

Abstract

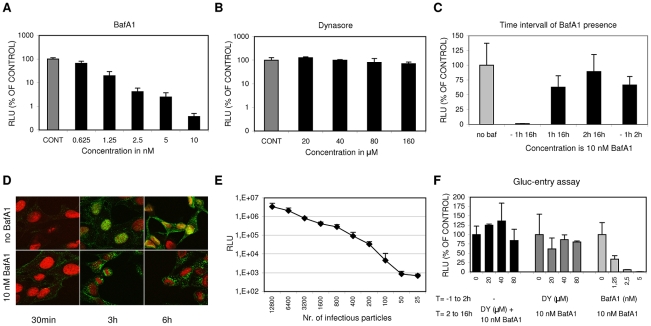
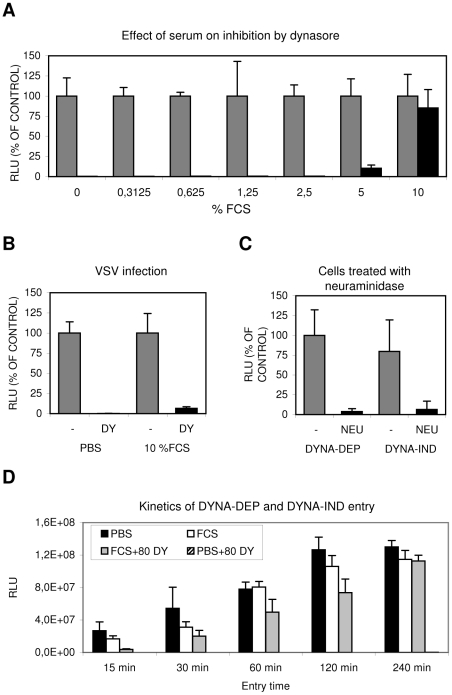
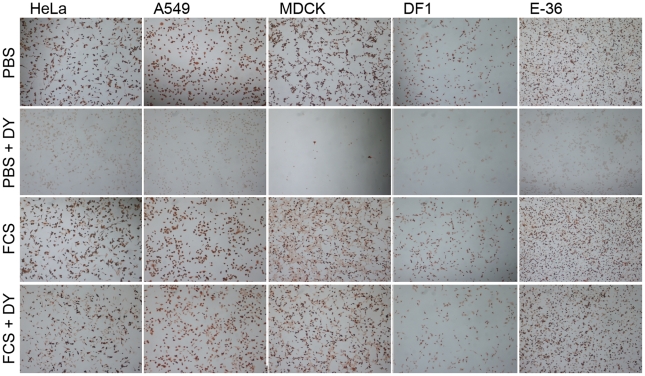
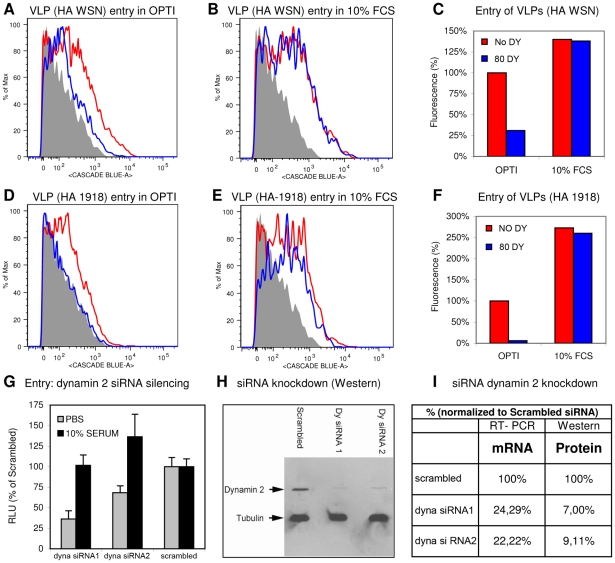
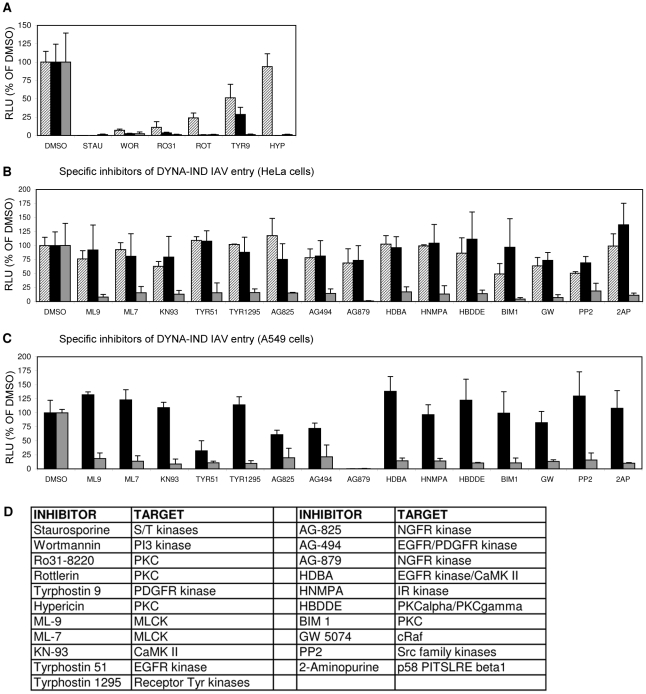
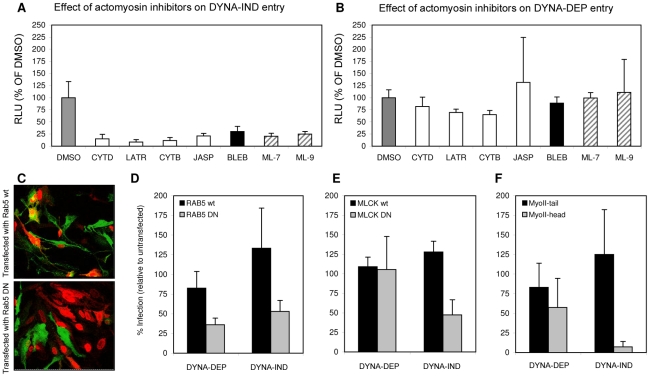
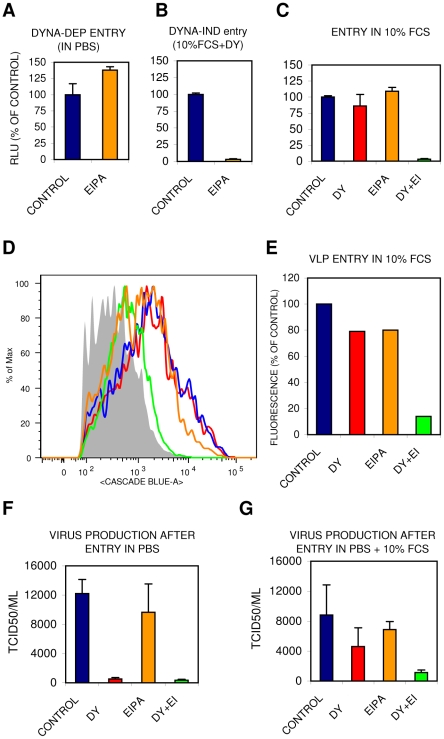
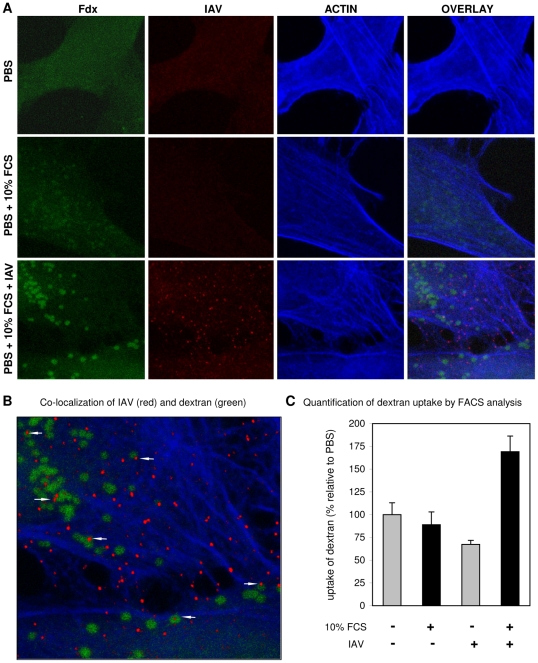
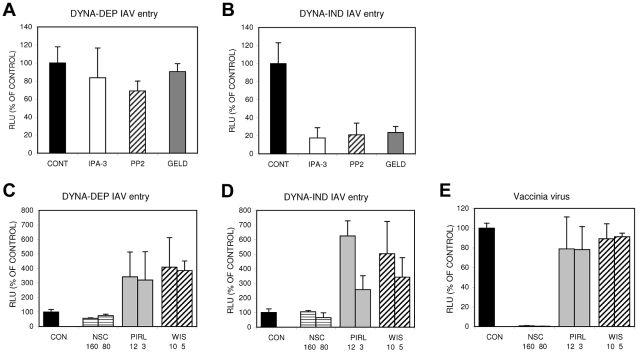
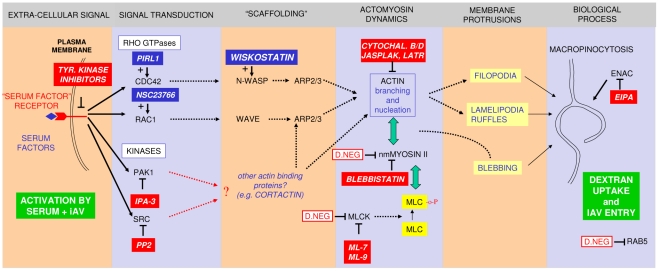
Influenza A virus (IAV) enters host cells upon binding of its hemagglutinin glycoprotein to sialylated host cell receptors. Whereas dynamin-dependent, clathrin-mediated endocytosis (CME) is generally considered as the IAV infection pathway, some observations suggest the occurrence of an as yet uncharacterized alternative entry route. By manipulating entry parameters we established experimental conditions that allow the separate analysis of dynamin-dependent and -independent entry of IAV. Whereas entry of IAV in phosphate-buffered saline could be completely inhibited by dynasore, a specific inhibitor of dynamin, a dynasore-insensitive entry pathway became functional in the presence of fetal calf serum. This finding was confirmed with the use of small interfering RNAs targeting dynamin-2. In the presence of serum, both IAV entry pathways were operational. Under these conditions entry could be fully blocked by combined treatment with dynasore and the amiloride derivative EIPA, the hallmark inhibitor of macropinocytosis, whereas either drug alone had no effect. The sensitivity of the dynamin-independent entry pathway to inhibitors or dominant-negative mutants affecting actomyosin dynamics as well as to a number of specific inhibitors of growth factor receptor tyrosine kinases and downstream effectors thereof all point to the involvement of macropinocytosis in IAV entry. Consistently, IAV particles and soluble FITC-dextran were shown to co-localize in cells in the same vesicles. Thus, in addition to the classical dynamin-dependent, clathrin-mediated endocytosis pathway, IAV enters host cells by a dynamin-independent route that has all the characteristics of macropinocytosis.


Conflict of interest statement

The authors have declared that no competing interests exist.

Figures

Figure 1
Figure 1. A luciferase reporter assay for quantitative analysis of IAV entry.
(A, and B) HeLa cells were transfected with the IAV reporter plasmid pHH-Gluc 24 hrs before infection. Inhibitors were added at 1 hr before infection with IAV (strain WSN; MOI of 0.1). Cells were kept at 37°C in DMEM supplemented with 10% FCS at all times. Luciferase activity (RLU, Relative Light Units) was measured 16 hrs p.i. and plotted on the Y-axes relative to the control (infection in presence of 0.2% DMSO, the solvent of both inhibitors) (error bars represent S.D. derived from triplicates). (A) Inhibitory effect of BafA1 (concentration range 0.625 nM to 10 nM on the x-axis) (B) Inhibitory effect of Dynasore (concentration range 20 to 160 µM on the x-axis) (C) The effect of the presence of 10 nM BafA1 during different periods (−1 hr to 16 hrs p.i.; 1 hr to 16 hrs p.i.; 2 hrs to 16 hrs p.i. and −1 hr to 2 hrs p.i as plotted on the x-axis) of a multi-cycle infection with IAV (strain WSN; MOI 0.5). Y-axis and control as in panel A and B. BafA1 was only strongly inhibitory when already present before inoculation with IAV. Reversibility of inhibition was shown upon withdrawal of BafA1 at 2 hrs p.i. (−1 hr to 2 hrs). (D) Examination of the effect of 10 nM BafA1 on subcellular localization of IAV particles by confocal fluorescence microscopy. HeLa cells were grown on glass cover slips and infected with IAV (strain WSN; MOI of 10) and fixated after 30 min, 3 hrs or 6 hrs (column 1, 2 or 3 respectively). Infection was performed in 0.2% DMSO (upper row panels) or in the presence of 10 nM BafA1 (lower row panels). The nucleus was visualized by DNA staining with TOPRO-3 (red). IAV infection was visualized by staining with monoclonal antiserum directed against NP (green). In the absence of inhibitor, IAV localized to the nucleus after 3 hrs, while new virus particles spread to the cytoplasm after 6 hrs. BafA1 (lower row panels) caused accumulation of incoming virus particles at a peri-nuclear location. (E) Quantitative determination of IAV entry by a single-cycle Gluc-entry assay. HeLa cells (10,000 cells/well in DMEM supplemented with 10% FCS) were transfected with pHH-Gluc 24 hrs prior to infection with a serial dilution of infectious IAV particles (plotted on the x-axis). Two hours after infection 10 nM BafA1 was added to block any further entry. Cells were incubated for a further 14 hrs to allow expression of luciferase activity (y-axis; Relative Light Units, RLU). (F) Effect of Dynasore and BafA1 on IAV entry in the Gluc-entry assay. Dynasore (DY, dark grey bars; 20, 40 or 80 µM) or BafA1 (light grey bars; 1.25, 2.5 or 5 nM) were present from 1 hr prior to infection (strain WSN; MOI 0.5) to 2 hrs p.i. after which the inhibitor-containing medium was replaced with medium containing 10 nM BafA1 to block any further entry. Cells were incubated for a further 14 hrs to allow the quantitative expression of luciferase activity (y-axes; RLU relative to the control infection without inhibitor). Whereas BafA1 displayed dose-dependent inhibition of IAV entry, dynasore did not significantly inhibit IAV entry. Addition of Dynasore (DY, 20, 40 or 80 µM) at 2 hrs p.i. (black bars; MOI 0.5; no inhibitors present from −1 to 2 hrs) demonstrated that Dynasore does not have a post-entry effect.
Figure 2
Figure 2. Serum induces a Dynasore resistant entry route.
(A) The effect of increasing concentrations of FCS (in PBS) on IAV entry. HeLa cells were infected in the absence (grey bars) or presence (black bars) of 80 µM dynasore with IAV (strain WSN; MOI 0.5) using the Gluc-entry assay. Entry was determined in presence of increasing concentrations of FCS (plotted on the x-axis). Luciferase activity was determined 16 hrs p.i. (plotted on the y-axis relative to the activity obtained in absence of dynasore (grey bars, 100%) for each concentration of FCS. Entry of IAV became completely dynasore-resistant in the presence of 10% FCS. (B) Inhibition of VSV entry by 80 µM dynasore (DY) in presence of 10% FCS. HeLa cells were infected with VSV in PBS or PBS+10% FCS (labeled 10% FCS) in absence (grey bars) or presence (black bars) of 80 µM dynasore (DY). In presence of 10% FCS VSV infection appears still to be fully sensitive to dynasore. (C) IAV entry via the dynamin-dependent (DYNA-DEP) or dynamin-independent (DYNA-IND) route depends on the presence of sialic acid receptors. Hela cells were treated with V. cholerae neuraminidase (NEU; black bars) or mock-treated (-; grey bars) prior to infection in order to remove surface exposed sialic acids. Cells were infected (strain WSN; MOI 0,5) using the Gluc-entry assay. DYNA-DEP entry was determined in PBS and DYNA-IND entry in PBS containing 10% FCS and 80 µM dynasore. Both pathways appear to be equally sensitive to de-sialylation of cells. (D) Comparison of the kinetics of DYNA-DEP IAV entry and DYNA-IND IAV entry. DYNA-DEP entry was determined in PBS and DYNA-IND entry in PBS containing 10% FCS and 80 µM dynasore (80 DY) using the Gluc-entry assay as described for panel C. Entry was allowed to proceed for 15 to 240 minutes (x-axis) by the addition of full growth medium containing 10 nM BafA1 at the indicated timepoints p.i. Luciferase activity was plotted in absolute RLU (y-axis), demonstrating that similar entry efficiencies were obtained via the two pathways after 4 hrs of entry. The experiment was repeated several times with different batches of serum yielding similar results.
Figure 3
Figure 3. Serum-inducible DYNA-IND IAV entry in different cell types.
HeLa cells, A549 cells (human epithelial lung carcinoma cells), MDCK cells (canine kidney cells), DF-1 cells (chicken embryonic fibroblast cells) and E-36 cells (Chinese hamster lung cells) were infected with IAV (MOI 2) in PBS or in PBS supplemented with 10% FCS in the absence or presence of 80 µM dynasore (DY). After 2 hrs the entry medium was replaced by growth medium (DMEM with 10% FCS and 10 nM BafA1) and infection was continued for 14 h after which the cells were fixed, permeabilized and stained with a monoclonal antibody against NP (detection by peroxidase staining).
Figure 4
Figure 4. Identification of DYNA-IND entry in a VLP entry assay and by siRNA knockdown of dynamin 2.
FACS histograms displaying the entry of IAV VLPs, containing the BlaM1 reporter and carrying either the WSN (A and B) or the 1918 (D and E) HA and NA, in Optimem (OPTI) without (A and D) or with (B and E) 10% FCS, and in the absence (red lines) or presence (blue lines) of 80 µM dynasore are shown. Release of BlaM1 into the cytoplasm upon VLP fusion results in cleavage of the CCF2 substrate thereby causing emission of a fluorescent signal at 447 nm (X-axis; Cascade Blue). In the histograms entry is displayed by a shift to higher fluorescence (the grey area represents background fluorescence of non-infected cells). (C and F) Quantification of FACS results. Background fluorescence was subtracted from each measurement (geometric mean) and data were normalized to VLP entry in Optimem without dynasore (DY) (red curve of panel A and and D). VLP entry was not inhibited by dynasore in presence of 10% FCS whereas the access of BlaM1 to its CCF2 substrate in the cytoplasm was blocked by dynasore in PBS. VLP entry was more efficient in the presence of serum. (G) Effect of downregulation of dynamin 2 by siRNA silencing. Serum-inducible DYNA-IND entry was analyzed in HeLa cells that were transfected 48 hrs prior to infection with two different siRNAs targeting dynamin-2 (dyna). siRNA treated cells were infected with the pseudovirus WSN-Ren in PBS (grey bars) or in PBS containing 10% FCS (black bars) and luciferase activity was determined after 16 hrs post infection (y-axis; RLU relative to infection of cells transfected with a scrambled siRNA). Entry of pseudovirus WSN-Ren (MOI 0.5) was reduced by 50% to 70% when entry was performed in PBS (grey bars) whereas entry was not significantly affected in the presence of 10% serum (black bars). (H) Western blot showing the knockdown of dynamin 2 (in comparison to tubulin) at 48 hrs after transfection with siRNAs. (I) Quantification of the residual levels of dynamin 2 (dyna) mRNA (determined by quantitative RT-PCR) and protein (determined by densitometric scanning of the western blot) 48 hrs after siRNA transfection. Data were normalized to 18S RNA (RT-PCR) or tubulin protein levels and calculated relative to the levels obtained after transfection with a scrambled siRNA that served as a control.
Figure 5
Figure 5. Screening of an eighty-compound protein kinase inhibitor library in an IAV entry assay.
HeLa cells were incubated with kinase inhibitors at a concentration of 10 µM from 1 hr prior to infection (strain WSN; MOI 0.5). Entry (Gluc-entry assay) was performed for 2 hrs in the presence of the inhibitors under DYNA-DEP entry conditions (entry in PBS; black bars) and DYNA-IND entry conditions (entry in PBS supplemented with 10% FCS and 80 µM dynasore; grey bars. In addition, all inhibitors were added 2 hrs p.i. to cells that had not been treated with inhibitors during entry (in presence of 10% FCS) in order to screen for post-entry effects (striped bars). (A) Inhibitors that were inhibitory for both entry routes and mostly also affected post-entry events. (B) Inhibitors that affect DYNA-IND entry but neither displayed effects on DYNA-DEP entry or post-entry effects. (C) All kinase inhibitors were also screened on A549 cells. Black and grey bars correspond to DYNA-DEP and DYNA-IND entry. (D) Targets of inhibition of the different kinase inhibitors are listed. All inhibitors have been tested at a standard concentration of 10 µM. Whereas for some inhibitors higher concentrations may be required for efficient inhibition of their specific target, for other inhibitors this concentration is relatively high and other targets may be inhibited as well. For instance wortmannin is known to inhibit PI4 kinase and MLCK at a 10 µM concentration.
Figure 6
Figure 6. Actomyosin network dynamics are required for DYNA-IND entry by IAV.
(A and B) Compounds affecting actin polymerization/de-polymerization (20 µM cytochalasin D [CYTD], 20 µM cytochalasin B [CYTB], 1 µM Latrunculin A [LATR], 1 µM Jasplakinolide [JASP]), inhibitors of MLCK (5 µM ML-7 and 5 µM ML-9) and an inhibitor of myosin II, (80 µM Blebbistatin [BLEB]) were examined for their effect on DYNA-IND IAV entry in PBS (A) or DYNA-DEP IAV entry (in PBS, 10% FCS and 80 µM dynasor) (B) using the Gluc-entry assay (HeLa cells; strain WSN; MOI 0.5; incubation with inhibitors from 1 hr prior to infection to 2 hrs p.i.). Luciferase activity was determined 16 hrs p.i. (RLU plotted on the y-axis relative to the activity obtained in absence of compounds affecting the actomysoin network (grey bars, 100%). (C) An example of confocal images of HeLa cells, expressing a wildtype Rab5-GFP fusion protein (Rab5 wt) (upper panel, green fluorescence identifies transfected cells) or a dominant-negative mutant of a Rab5-GFP fusion protein (RAB5 DN; lower panel), inoculated with IAV (strain WSN; MOI 1). Infection was performed for 4 hrs after which cells were fixed and stained (red staining with a monoclonal antibody directed against NP identifies infected cells; In the example of panel C infection was performed in PBS in order to examine the DYNA-DEP entry pathway) Similar experiments were performed for GFP fusion proteins with dominant-negative and wildtype MLCK (MLCK DN and MLCK wt) and Myosin II-tail domain (MyoII-tail) or MyosinII-head domain (MyoII-head). Transfected cells were infected under DYNA-DEP (PBS) and DYNA-IND (PBS, 10% FCS and 80 µM dynasor) entry conditions. (D–F) Results were quantified by counting >100 cells (experiment performed in triplo; transfected cells, infected cells and cells that were transfected as well as infected were counted). Relative infection of transfected cells was plotted (taking infection of non-transfected cells in the same sample as 100%). Thus, whereas Rab5 wt transfected cells are not significantly reduced or enhanced in infection compared to non-transfected cells (D, black bars), Rab5 DN transfected cells (D, grey bars) are infected at lower levels both under DYNA-DEP and DYNA-IND entry conditions. In contrast, cells transfected with MCLK DN (E) or MyoII-head (F) were infected at significantly lower levels via the DYNA-IND pathway while the DYNA-DEP pathway was not affected. Transfection efficiency for the different constructs was as follows: RAB5 wt (61%); RAB5 DN (45%); MLCK wt (50%); MLCK DN (49%); MyoII-tail (69%); MyoII-head (55%).
Figure 7
Figure 7. The DYNA-IND IAV entry pathway is EIPA sensitive.
The effect of 80 µM EIPA on DYNA-DEP (A) or DYNA-IND (B) entry was examined in the Gluc-entry assay (HeLa cells; strain WSN; MOI 0.5; incubation with EIPA from −1 hr to 2 hr p.i.). Data were plotted relative to the control (0.2% DMSO). (C) Redundancy of DYNA-DEP and DYNA-IND entry pathways in 10% FCS using the Gluc-entry assay. The effect of 80 µM dynasore (DY; red), 80 µM EIPA (orange) or 80 µM of both inhibitors (DY+EI; green) in the presence of 10% FCS is shown (HeLa cells; strain WSN; MOI 0.5). (D,E) Redundancy of DYNA-DEP and DYNA-IND entry pathways in 10% FCS using the VLP entry assay. VLP entry was performed in Optimem containing 10% serum in the presence of 80 µM dynasore (DY; red), 80 µM EIPA (orange) or 80 µM of both inhibitors (DY+EI; green). Panel E displays the quantified data of the FACS histograms displayed in panel D. (F,G) Virus production was measured by determining infectivity in the supernatant of cells inoculated in the presence of 80 µM dynasore (DY), 80 µM EIPA or 80 µM of both inhibitors (DY+EI) in PBS (panel E) or PBS+10% FCS (panel F). After 2 hr the medium was replaced by growth medium containing 10% FCS and 10 nM BafA1. Supernatant was harvested 24 hr p.i. for TCID50 determination (Y-axis).
Figure 8
Figure 8. Induction of uptake of dextran into vesicles by the combined action of serum and IAV.
(A) Uptake of FITC-dextran (Fdx; green) into HeLa cells in PBS, PBS+10% serum or PBS+10% serum+IAV (MOI = 10) was studied by confocal microscopy. IAV was detected by fluorescence staining with monoclonal antibody directed against NP. The actin network of cells was stained by phalloidin. Whereas vesicular structures containing Fdx become visible in the presence of serum, these structures become much more apparent in the simultaneous presence of serum and IAV. (B) A magnification of Panel A demonstrating the co-localization of Fdx and IAV in vesicular structures (arrows). (C) Quantification of dextran uptake in presence or absence of IAV by FACS analysis. Fdx uptake was performed for 15 min at 37°C in PBS (grey bars) or in PBS containing 10% FCS (black bars) in absence or presence of IAV (strain WSN; MOI 10) as indicated at the x-axis. Background fluorescence from Fdx binding to the outside of cells was determined by performing the same experiment at 4°C (at which no endocytosis takes place) and was subtracted from the mean fluorescence intensity obtained at 37°C to determine the amount of fluorescent FITC-dextran that was internalized at 37°C. Data were plotted relative to FITC-dextran uptake in PBS in absence of IAV.
Figure 9
Figure 9. The DYNA-IND IAV entry pathway is sensitive to inhibitors of PAK1, src and HSP90.
Inhibitors of PAK1 (40 µM IPA-3), src (10 µM PP2) or HSP90 (5 µM aa-geldanamycin (GELD)) were examined for their effect on DYNA-DEP (A) or DYNA-IND (B) entry using the Gluc-entry assay (HeLa cells; strain WSN; MOI 0.5; incubation with inhibitors from 1 hr prior to infection to 2 hrs p.i.). Inhibitors of Rac1 (80 µM and 160 µM NSC23766 (NSC)), Cdc42 (12.5 µM and 3.125 µM Pirl1) and N-WASP (10 µM and 5 µM wiskostatin (WIS)) were examined for their effect on DYNA-DEP (C) or DYNA-IND (D) entry using the Gluc-entry assay (HeLa cells; strain WSN; MOI 0.5; pre-incubation with inhibitors 1 hr prior to infection) and on infection by vaccinia virus (E). When Wiskostatin, NSC23766 or Pirl1 were added at t = 2 in order to check for their effect on replication we observed a dose-dependent inhibition by Pirl1 (60% inhibition at 12 uM) and no effect by wiskostatin or NSC23766 (result not shown).
Figure 10
Figure 10. A model for IAV entry by macropinocytosis.
The model summarizes the inhibitory (red boxes) or stimulatory (blue boxes) effects of compounds on dynamin-independent IAV entry. The effect of over-expression of dominant-negative mutants is indicated by red-lined boxes. The pathway requires the presence of serum factors in the entry medium and results in the enhanced uptake of dextran and its co-localization with IAV in large vesicles (green boxes). We hypothesize that the interaction of serum factors and/or IAV with receptor tyrosine kinases (RTKs) is the primary signal for the induction of macropinocytosis. A number of RTKs have been shown to be involved in this process in different cell lines. Remarkably, a recently published genome-wide siRNA screen of IAV infection identified the FGF receptor as a host factor required for influenza virus replication . Activation of Rho family GTPases CDC42 and/or Rac1 has been shown to be essential for signal transduction leading to macropinocytosis in many cases , but inhibitors are without effect or are stimulatory in the case of IAV entry. Downstream effectors of Rho family GTPases include scaffold proteins like N-WASP and WAVE and protein kinases like PAK1. Macropinocytic entry of IAV however seems to require a Rho family GTPase-independent PAK1 activation mechanism. In addition, src family kinases, which can be directly activated by RTKs, play a role. PAK1 and src have previously been linked to the activation of macropinocytosis via their effect on changes in actomyosin dynamics, a process which is crucial to any form of macropinosome formation , . Apart from N-WASP- or WAVE-containing macromolecular assemblies other actin binding proteins can induce such changes (e.g. cortactin, which can be activated by src [81]) and thereby induce the formation of one of the different plasma membrane protrusions that can result in the formation of macropinosomes. In addition to an effect on the formation of plasma membrane protrusions and subsequent macropinosome formation, inhibitors can also affect downstream trafficking and maturation of macropinosomes which might be actin-dependent, but this is not depicted in the scheme.

References

    1. Patterson S, Oxford JS, Dourmashkin RR. Studies on the mechanism of influenza-virus entry into cells. J Gen Virol. 1979;43:223–229. - PubMed
    1. Matlin KS, Reggio H, Helenius A, Simons K. Infectious entry pathway of Influenza Virus in a Canine Kidney Cell line. J Cell Biol. 1981;91:601–613. - PMC - PubMed
    1. Rust MJ, Lakadamyali M, Zhang F, Zhuang X. Assembly of endocytotic machinery around individual influenza viruses during viral entry. Nat Struct Mol Biol. 2004;11:567–573. - PMC - PubMed
    1. Chen C, Zhuang X. Epsin 1 is a cargo-specific adaptor for the clathrin-mediated endocytosis of influenza virus. Proc Natl Acad Sci U S A. 2008;105:11790–11795. - PMC - PubMed
    1. Chu VC, Whittaker GR. Influenza virus entry and infection require host cell N-linked glycoprotein. Proc Natl Acad Sci U S A. 2004;101:18153–18158. - PMC - PubMed

Publication types