. 2011 Mar 1;2(4):748-63.
doi: 10.1364/BOE.2.000748.

Imaging cone photoreceptors in three dimensions and in time using ultrahigh resolution optical coherence tomography with adaptive optics

Affiliations

Imaging cone photoreceptors in three dimensions and in time using ultrahigh resolution optical coherence tomography with adaptive optics

Omer P Kocaoglu et al. Biomed Opt Express. .

Abstract

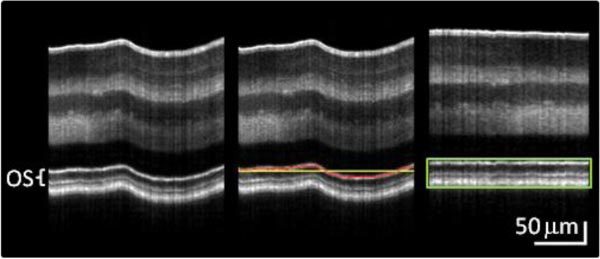
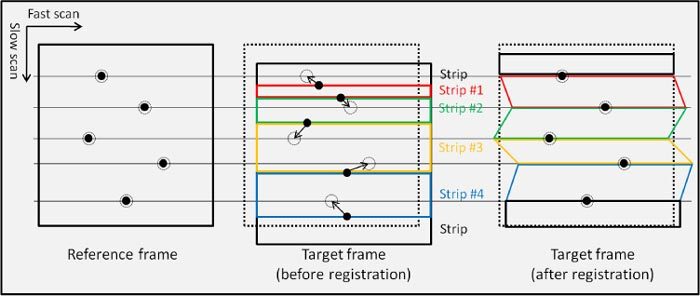
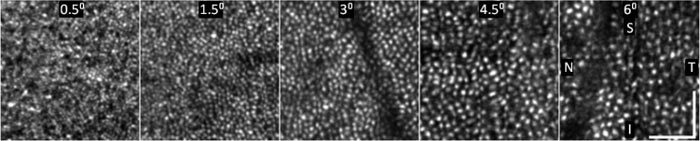
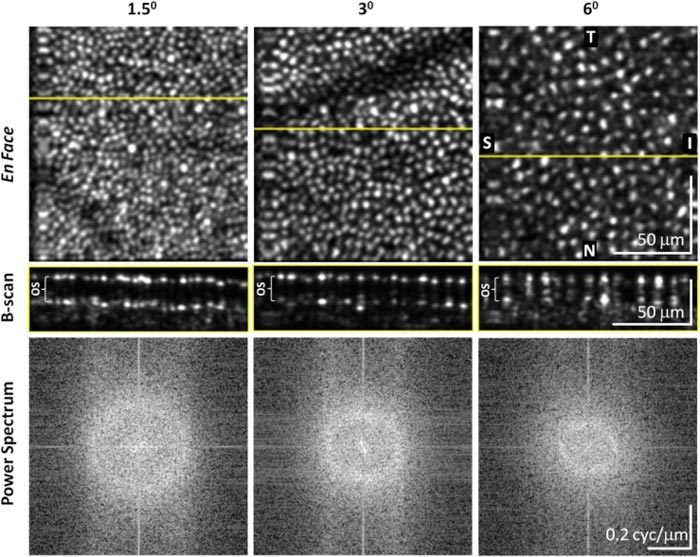
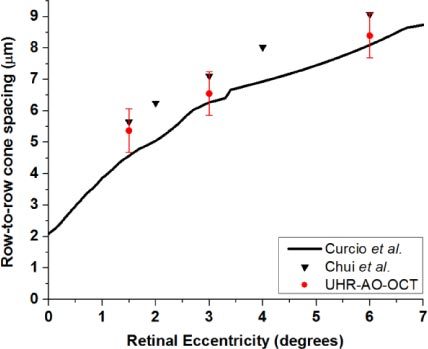
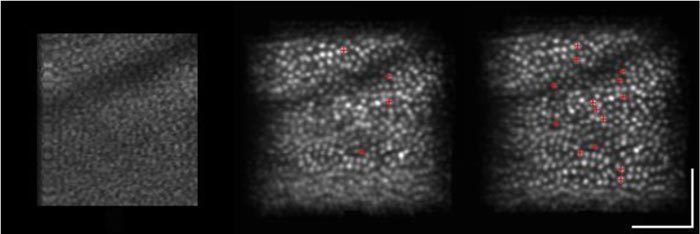
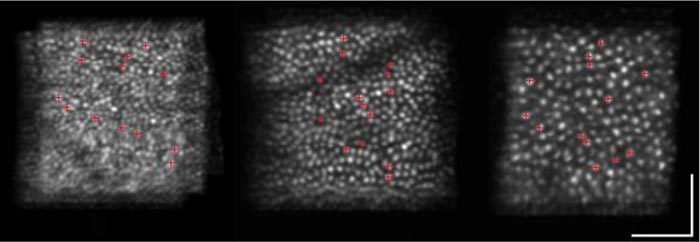
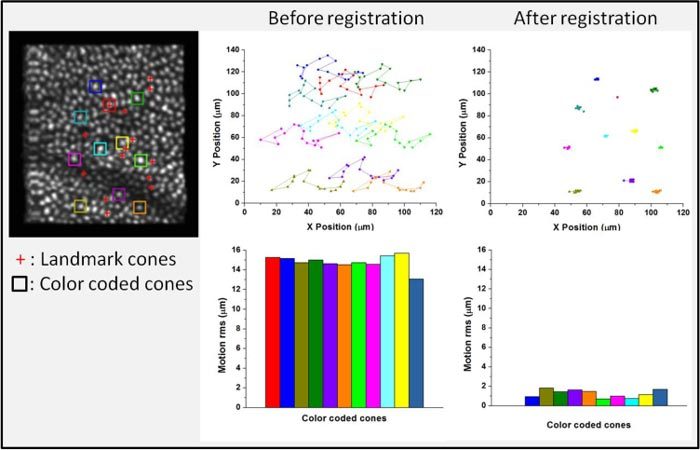
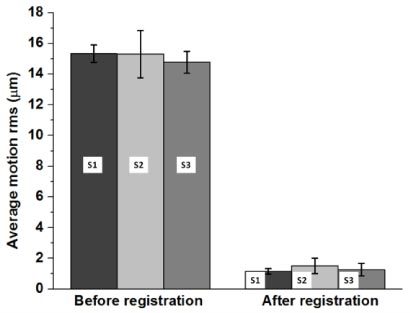
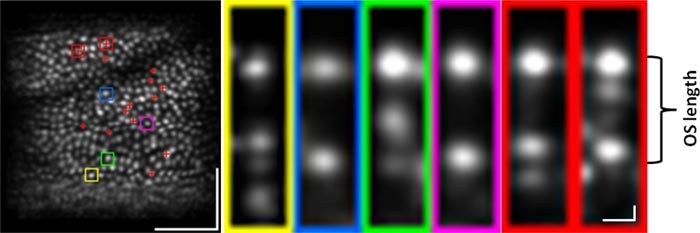
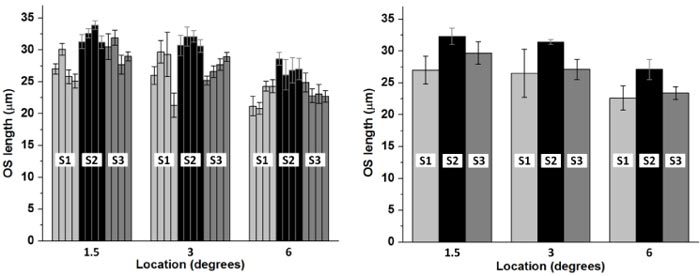
Cone photoreceptors in the living human eye have recently been imaged with micron-scale resolution in all three spatial dimensions using adaptive optics optical coherence tomography. While these advances have allowed non-invasive study of the three-dimensional structure of living human cones, studies of their function and physiology are still hampered by the difficulties to monitor the same cells over time. The purpose of this study is to demonstrate the feasibility of cone monitoring using ultrahigh-resolution adaptive optics optical coherence tomography. Critical to this is incorporation of a high speed CMOS camera (125 KHz) and a novel feature-based, image registration/dewarping algorithm for reducing the deleterious effects of eye motion on volume images. Volume movies were acquired on three healthy subjects at retinal eccentricities from 0.5° to 6°. Image registration/dewarping reduced motion artifacts in the movies from 15 μm to 1.3 μm root mean square, the latter sufficient for identifying and tracking cones. Cone row-to-row spacing and outer segment lengths were consistent with that reported in the literature. Cone length analysis demonstrates that UHR-AO-OCT is sufficiently sensitive to measure real length differences between cones in the same 0.5° retinal patch, and requires no more than five measurements of OS length to achieve 95% confidence. We know of no other imaging modality that can monitor foveal or parafoveal cones over time with comparable resolution in all three dimensions.

Keywords: (110.1080) Active or adaptive optics; (170.4500) Optical coherence tomography.


Figures

Fig. 1
Fig. 1
Procedure for axially registering UHR-AO-OCT volume movies. Shown is a projected slow B-scan (each column is the average of a single fast B-scan) at various stages of the process: (left) before axial registration; (center) segmentation of CC (red line) and determination of its mean height (yellow line); and (right) axial shifting of fast B-scans to align CC (red line in (center)) to their mean height (yellow line in (center)). Green rectangle denotes the region of interest (PL and RPE complex) that is cropped and used for further processing. OS: outer segment of cone photoreceptors.
Fig. 2
Fig. 2
Procedure for lateral registration of cone photoreceptors in en face projections from UHR-AO-OCT volumes. ●: landmark cones, ◌: reference positions of landmark cones. (left) Landmark cones are selected and their reference positions determined in the first frame of the movie that had little to no apparent motion artifacts. (center) Each subsequent frame in the volume movie is segmented into 10 to 15 narrow strips whose long dimension is parallel to the fast scan direction. The border of each strip is defined by two landmark cones. (right) To register a strip, landmark cones are repositioned to their original (reference) positions using two linear transformations: scaling (shrinking and expanding) in slow scan direction and shearing in fast scan direction. After registration of the strips, the strips are reassembled to form a registered image. Note that the top and bottom strips are not registered as two landmark cones are needed to do so. The registration process is fully automated once the landmark cone coordinates are found. See text for additional details.
Fig. 3
Fig. 3
Representative en face images of cone photoreceptors of S3 at 0.5°, 1.5°, 3°, 4.5°, and 6° temporal to the fovea. Scale bars indicate 50 μm. N, T, S, and I denote nasal, temporal, superior, and inferior directions at the retina.
Fig. 4
Fig. 4
(top row) Cone photoreceptor images of S3 at 1.5°, 3°, and 6° temporal to the fovea. N, T, S, and I denote nasal, temporal, superior, and inferior directions at the retina. (middle row) Cross-sectional images (fast B-scans) of the PL-RPE complex are shown for the same three retinal eccentricities with location indicated by the yellow lines on the en face images. Media 1 shows movie versions that depict the yellow lines sliding on the en face images and corresponding B-scans for the entire UHR-AO-OCT volumes. (bottom row) Power spectra were computed from the corresponding en face images. Rings of concentrated power and centered on zero spatial frequency are visible. Note that the en face images (top row) are rotated 90° relative to the images in Fig. 3. The rotation was necessary for alignment to the fast B-scans (middle row).
Fig. 5
Fig. 5
Comparison of cone photoreceptor spacing measured with UHR-AO-OCT, AO-SLO [24], and histology [37]. All measurements are temporal of the fovea. Error bars represent ± 1 standard deviation.
Fig. 6
Fig. 6
Average of 15 0.5°x0.5° en face images from the same volume video (left) before and (center and right) after registration/dewarping. Images were acquired from subject S3 at 3° temporal to the fovea. Registration/dewarping was based on (center) three subframe strips (4 landmark cones marked with red crosses) and (right) 13 subframe strips (14 landmark cones marked with red crosses). Media 2 shows the corresponding movie versions of each image. Scale bars indicate 50 μm.
Fig. 7
Fig. 7
Average of 15 en face images from the same volume movies of S3 at (left) 1.5°, (center) 3°, and (right) 6° temporal to the fovea after registration/dewarping. Registration/dewarping was based on (left) 12, (center) 13, and (right) 12 subframe strips (13, 14, and 13 landmark cones, respectively). Media 3 shows the registered en face UHR-AO-OCT movies from which the average images were computed. Retinal motion for the three videos are comparable with an en face motion RMS of 2.2 μm, 1.2 μm, 0.97 μm for 1.5°, 3°, and 6°, respectively. For comparison, RMS retinal motion before registration were 14.4 μm, 14.7 μm, 10.6 μm. Scale bars indicate 50 μm.
Fig. 8
Fig. 8
(left column) An en face frame from the volume movie at 3° temporal to the fovea. Red crosses mark the locations of 14 landmark cones used for registration. Color-coded squares mark the locations of 11 cones that were tracked during the volume video. 10 of the cones were randomly selected but present in all frames, while one was intentionally selected as a landmark cone (red). (center column) Traces of en face position of the 11 cones and RMS magnitude of each cone (landmark cone is red) are shown without registration. (right column) Traces of en face position and RMS magnitude of the same 11 cones are shown with registration/dewarping. Registration/dewarping used 13 strips (14 landmark cones).
Fig. 9
Fig. 9
Lateral motion of the retina during UHR-AO-OCT image acquisition before and after registration/dewarping. Averages are shown for each subject (S1, S2, and S3). Each bar represents the average RMS of five cones selected in volume videos at 3°. Error bars represesent ± 1 standard deviation of the five cone measurements.
Fig. 10
Fig. 10
(left) Averaged en face image of S3 at 3° temporal to the fovea after registration and (right) cross-sectional images of individual cones. En face locations of cross-sectional images are marked by colored squares (yellow, blue, green, violet, red). Landmark cones used for registration are marked with red crosses. The cross-sectional cone images shown in red are landmark cones. Media 4 shows the registered en face UHR-AO-OCT movie from which the average image was computed along with cross-sectional movies of the six cones selected. Scale bars on the projection and cross-sectional images indicate 50 μm and 5 μm, respectively.
Fig. 11
Fig. 11
UHR-AO-OCT measurement of cone OS length. (left) Average OS length of individual cones at 1.5°, 3°, and 6° temporal to the fovea and for the three subjects (four cones per eccentricity per subject). Error bars represent ± 1 standard deviation of 10 to 15 (14.2, on average) OS length measurements (intra-cone variability). (right) Average OS length of four cones at the same retinal eccentricity and same subject. Error bars represent ±1 standard deviation of OS length measurements over the four cones (inter-cone variability).

References

    1. Wojtkowski M., Leitgeb R., Kowalczyk A., Bajraszewski T., Fercher A. F., “In vivo human retinal imaging by Fourier domain optical coherence tomography,” J. Biomed. Opt. 7(3), 457–463 (2002). 10.1117/1.1482379 - DOI - PubMed
    1. Cense B., Nassif N., Chen T., Pierce M., Yun S. H., Park B., Bouma B., Tearney G., de Boer J., “Ultrahigh-resolution high-speed retinal imaging using spectral-domain optical coherence tomography,” Opt. Express 12(11), 2435–2447 (2004). 10.1364/OPEX.12.002435 - DOI - PubMed
    1. Wojtkowski M., Srinivasan V., Fujimoto J. G., Ko T., Schuman J. S., Kowalczyk A., Duker J. S., “Three-dimensional retinal imaging with high-speed ultrahigh-resolution optical coherence tomography,” Ophthalmology 112(10), 1734–1746 (2005). 10.1016/j.ophtha.2005.05.023 - DOI - PMC - PubMed
    1. Zhang Y., Rha J., Jonnal R., Miller D. T., “Adaptive optics parallel spectral domain optical coherence tomography for imaging the living retina,” Opt. Express 13(12), 4792–4811 (2005). 10.1364/OPEX.13.004792 - DOI - PubMed
    1. Fernández E. J., Povazay B., Hermann B., Unterhuber A., Sattmann H., Prieto P. M., Leitgeb R., Ahnelt P., Artal P., Drexler W., “Three-dimensional adaptive optics ultrahigh-resolution optical coherence tomography using a liquid crystal spatial light modulator,” Vision Res. 45(28), 3432–3444 (2005). 10.1016/j.visres.2005.08.028 - DOI - PubMed

LinkOut - more resources