

Spotlight on differentially expressed genes in urinary bladder cancer
- PMID: 21483670
- PMCID: PMC3071699
- DOI: 10.1371/journal.pone.0018255
Spotlight on differentially expressed genes in urinary bladder cancer
Abstract
Introduction: We previously identified common differentially expressed (DE) genes in bladder cancer (BC). In the present study we analyzed in depth, the expression of several groups of these DE genes.
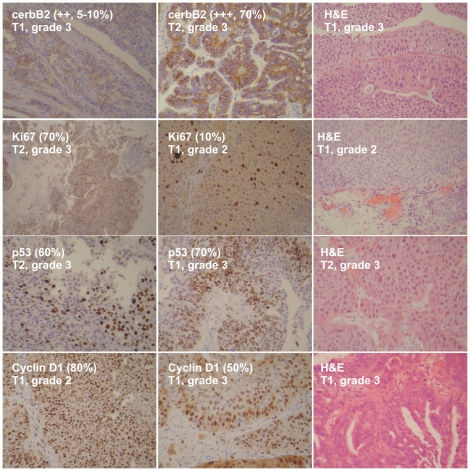
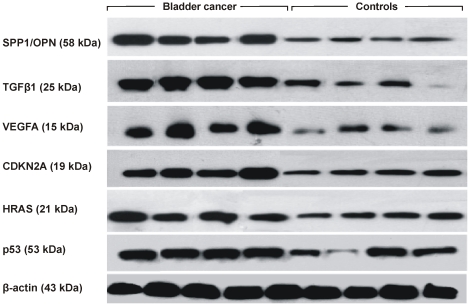
Materials and methods: Samples from 30 human BCs and their adjacent normal tissues were analyzed by whole genome cDNA microarrays, qRT-PCR and Western blotting. Our attention was focused on cell-cycle control and DNA damage repair genes, genes related to apoptosis, signal transduction, angiogenesis, as well as cellular proliferation, invasion and metastasis. Four publicly available GEO Datasets were further analyzed, and the expression data of the genes of interest (GOIs) were compared to those of the present study. The relationship among the GOI was also investigated. GO and KEGG molecular pathway analysis was performed to identify possible enrichment of genes with specific biological themes.
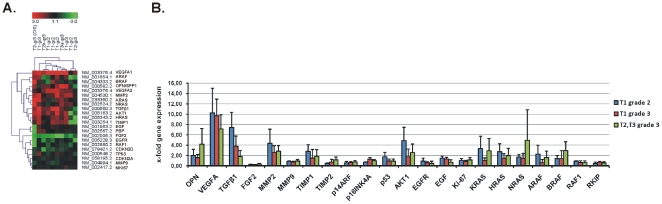
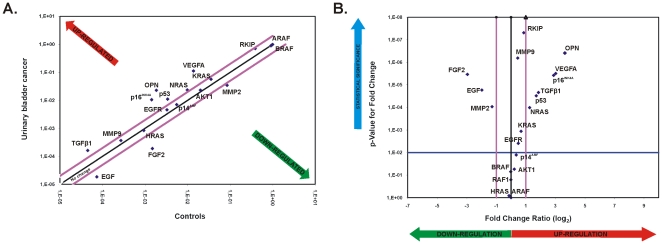
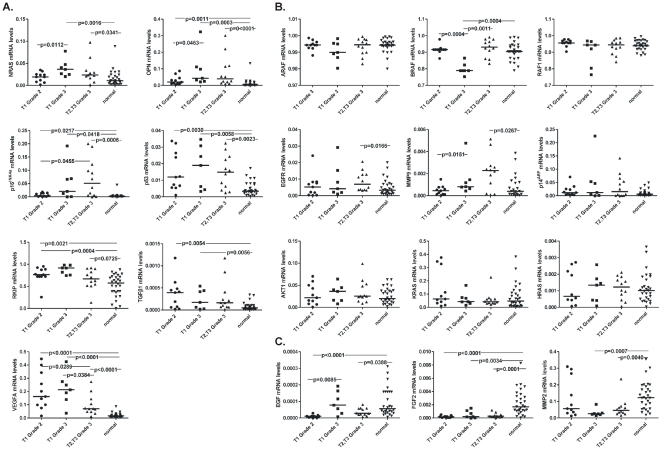
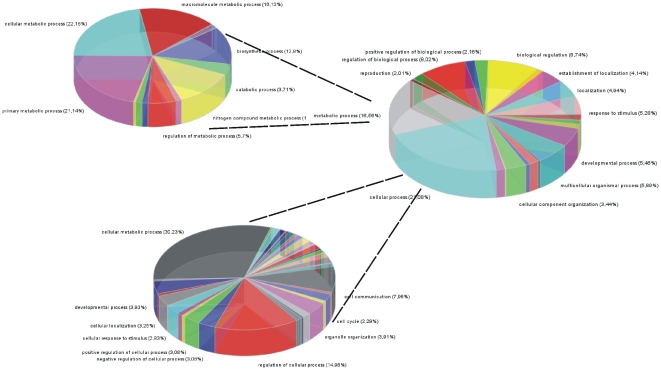
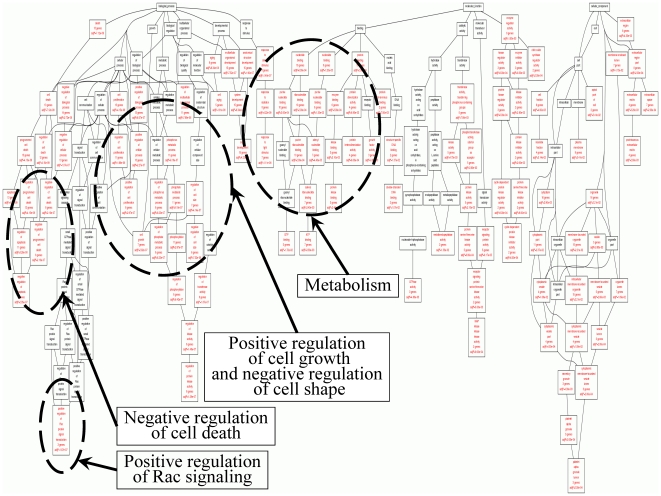
Results: Unsupervised cluster analysis of DNA microarray data revealed a clear distinction in BC vs. control samples and low vs. high grade tumors. Genes with at least 2-fold differential expression in BC vs. controls, as well as in non-muscle invasive vs. muscle invasive tumors and in low vs. high grade tumors, were identified and ranked. Specific attention was paid to the changes in osteopontin (OPN, SPP1) expression, due to its multiple biological functions. Similarly, genes exhibiting equal or low expression in BC vs. the controls were scored. Significant pair-wise correlations in gene expression were scored. GO analysis revealed the multi-facet character of the GOIs, since they participate in a variety of mechanisms, including cell proliferation, cell death, metabolism, cell shape, and cytoskeletal re-organization. KEGG analysis revealed that the most significant pathway was that of Bladder Cancer (p = 1.5×10(-31)).
Conclusions: The present work adds to the current knowledge on molecular signature identification of BC. Such works should progress in order to gain more insight into disease molecular mechanisms.
Conflict of interest statement
Figures
Similar articles
-
Identification of common differentially expressed genes in urinary bladder cancer.PLoS One. 2011 Apr 4;6(4):e18135. doi: 10.1371/journal.pone.0018135. PLoS One. 2011. PMID: 21483740 Free PMC article.
-
Identification of differentially expressed genes in human bladder cancer through genome-wide gene expression profiling.Oncol Rep. 2006 Sep;16(3):521-31. Oncol Rep. 2006. PMID: 16865252
-
DNA microarray expression profiling of bladder cancer allows identification of noninvasive diagnostic markers.J Urol. 2009 Aug;182(2):741-8. doi: 10.1016/j.juro.2009.03.084. Epub 2009 Jun 18. J Urol. 2009. PMID: 19539325
-
Gene expression profiling in bladder cancer identifies potential therapeutic targets.Int J Oncol. 2017 Apr;50(4):1147-1159. doi: 10.3892/ijo.2017.3893. Epub 2017 Mar 2. Int J Oncol. 2017. PMID: 28259975 Free PMC article.
-
Applications of array technology: identification of molecular targets in bladder cancer.Br J Cancer. 2003 Dec 15;89(12):2172-7. doi: 10.1038/sj.bjc.6601406. Br J Cancer. 2003. PMID: 14676790 Free PMC article. Review.
Cited by
-
A Novel Cyclic Pentadepsipeptide, N-Methylsansalvamide, Suppresses Angiogenic Responses and Exhibits Antitumor Efficacy against Bladder Cancer.Cancers (Basel). 2021 Jan 7;13(2):191. doi: 10.3390/cancers13020191. Cancers (Basel). 2021. PMID: 33430488 Free PMC article.
-
Fractal dimensions of in vitro tumor cell proliferation.J Oncol. 2015;2015:698760. doi: 10.1155/2015/698760. Epub 2015 Mar 25. J Oncol. 2015. PMID: 25883653 Free PMC article.
-
Identification of SPP1 as a Prognostic Biomarker and Immune Cells Modulator in Urothelial Bladder Cancer: A Bioinformatics Analysis.Cancers (Basel). 2023 Dec 4;15(23):5704. doi: 10.3390/cancers15235704. Cancers (Basel). 2023. PMID: 38067407 Free PMC article.
-
Gene set enrichment analysis of the NF-κB/Snail/YY1/RKIP circuitry in multiple myeloma.Tumour Biol. 2014 May;35(5):4987-5005. doi: 10.1007/s13277-014-1659-9. Epub 2014 Jan 31. Tumour Biol. 2014. PMID: 24481661
-
Gene expression is highly correlated on the chromosome level in urinary bladder cancer.Cell Cycle. 2013 May 15;12(10):1544-59. doi: 10.4161/cc.24673. Epub 2013 May 8. Cell Cycle. 2013. PMID: 23624844 Free PMC article.
References
-
- Ferlay J, Autier P, Boniol M, Heanue M, Colombet M, et al. Estimates of the cancer incidence and mortality in Europe in 2006. Ann Oncol. 2007;18:581–592. - PubMed
-
- van Rhijn BW, Burger M, Lotan Y, Solsona E, Stief CG, et al. Recurrence and progression of disease in non-muscle-invasive bladder cancer: from epidemiology to treatment strategy. Eur Urol. 2009;56:430–442. - PubMed
-
- Sylvester RJ, van der Meijden AP, Oosterlinck W, Witjes JA, Bouffioux C, et al. Predicting recurrence and progression in individual patients with stage Ta T1 bladder cancer using EORTC risk tables: a combined analysis of 2596 patients from seven EORTC trials. Eur Urol . 2006;49:466–465; discussion 475-467. - PubMed
-
- Lopez-Beltran A, Montironi R. Non-invasive urothelial neoplasms: according to the most recent WHO classification. Eur Urol. 2004;46:170–176. - PubMed
MeSH terms
Substances
LinkOut - more resources
Full Text Sources
Medical
Molecular Biology Databases
Research Materials
Miscellaneous
