Clinical Trial
. 2011 Apr 5;6(4):e18164.
doi: 10.1371/journal.pone.0018164.

Early and prolonged antiretroviral therapy is associated with an HIV-1-specific T-cell profile comparable to that of long-term non-progressors

Affiliations
Clinical Trial

Early and prolonged antiretroviral therapy is associated with an HIV-1-specific T-cell profile comparable to that of long-term non-progressors

Cristina Cellerai et al. PLoS One. .

Abstract

Background: Intervention with antiretroviral treatment (ART) and control of viral replication at the time of HIV-1 seroconversion may curtail cumulative immunological damage. We have therefore hypothesized that ART maintenance over a very prolonged period in HIV-1 seroconverters could induce an immuno-virological status similar to that of HIV-1 long-term non-progressors (LTNPs).

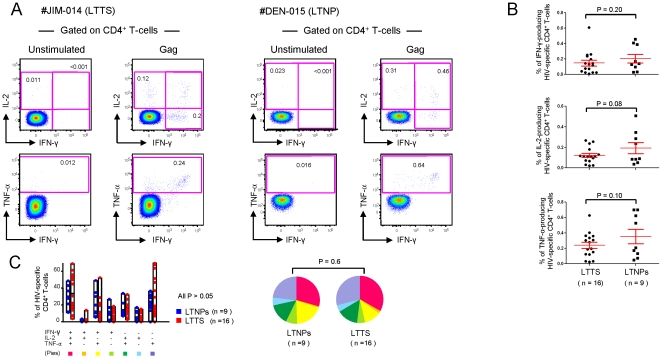
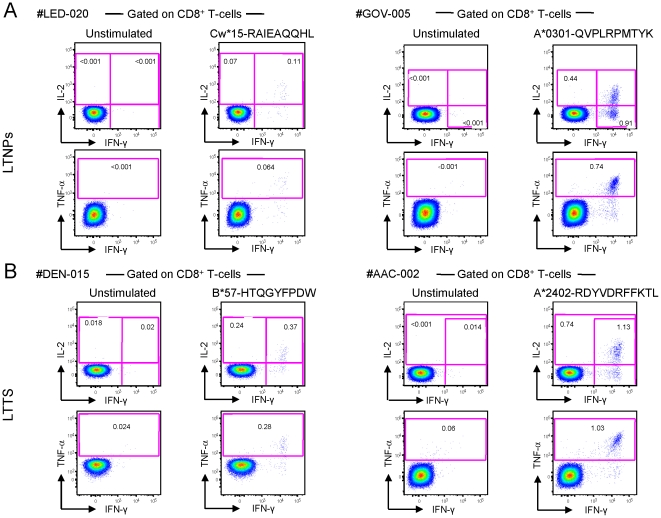
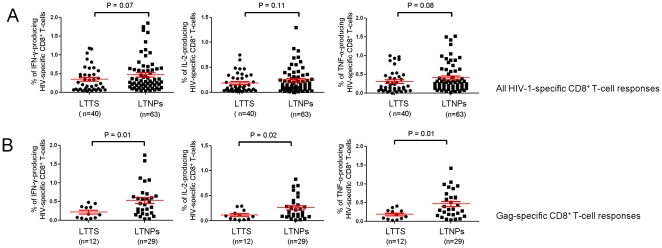
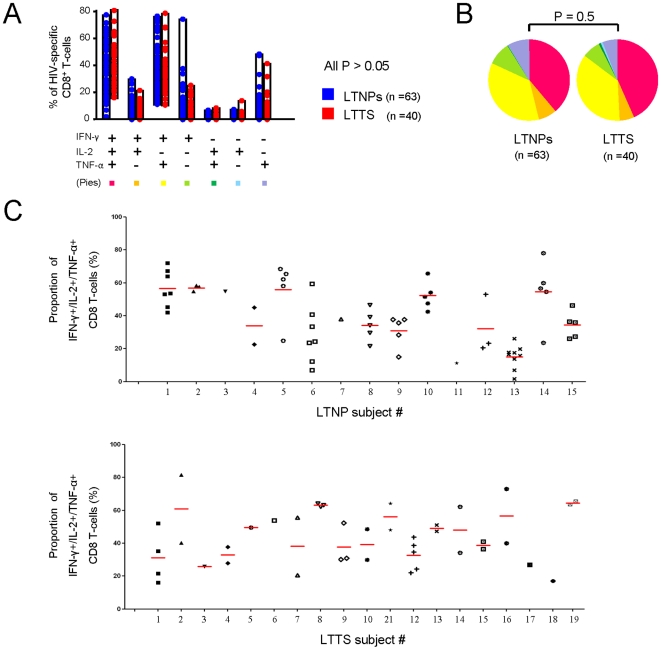
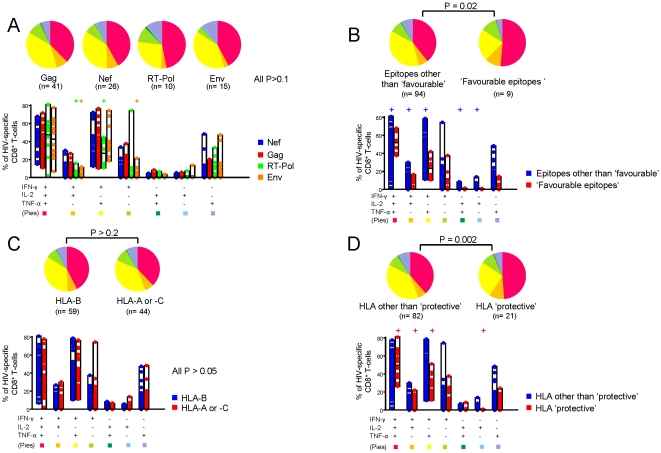
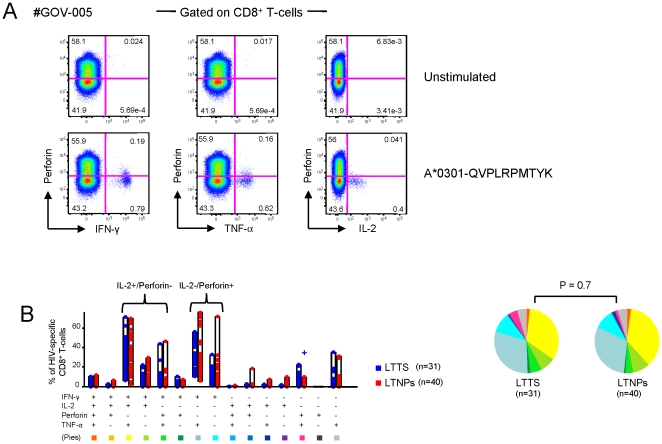
Methodology/principal findings: We have investigated a cohort of 20 HIV-1 seroconverters on long-term ART (LTTS) and compared it to one of 15 LTNPs. Residual viral replication and reservoirs in peripheral blood, as measured by cell-associated HIV-1 RNA and DNA, respectively, were demonstrated to be similarly low in both cohorts. These two virologically matched cohorts were then comprehensively analysed by polychromatic flow cytometry for HIV-1-specific CD4(+) and CD8(+) T-cell functional profile in terms of cytokine production and cytotoxic capacity using IFN-γ, IL-2, TNF-α production and perforin expression, respectively. Comparable levels of highly polyfunctional HIV-1-specific CD4(+) and CD8(+) T-cells were found in LTTS and LTNPs, with low perforin expression on HIV-1-specific CD8(+) T-cells, consistent with a polyfunctional/non-cytotoxic profile in a context of low viral burden.

Conclusions: Our results indicate that prolonged ART initiated at the time of HIV-1 seroconversion is associated with immuno-virological features which resemble those of LTNPs, strengthening the recent emphasis on the positive impact of early treatment initiation and paving the way for further interventions to promote virological control after treatment interruption.


Conflict of interest statement

Competing Interests: The authors have declared that no competing interests exist.

Figures

Figure 1
Figure 1. Functional cytokine profile of HIV-1 Gag-specific CD4+ T-cells.
(A) Shown are two representative flow cytometry profiles of Gag-specific CD4+ T-cell responses from a LTTS (dot plots on the left) and a LTNP (dot plots on the right) subject. The production of IL-2, TNF-α and IFN-γ was measured upon 6 hours of in vitro stimulation with the Gag peptide pool. (B) Cumulative data (mean±SE) on the percentage of IFN-γ-, IL-2- and TNF-α-producing HIV-1 specific CD4+ T-cells following stimulation with the Gag peptide pool. (C) Cumulative data of the simultaneous analysis of IFN-γ, IL-2 and TNF-α production. All possible combinations of IFN-γ, IL-2 and TNF-α production are shown on the x axis, whereas the percentage of the various cytokine-producing cell subsets within HIV-specific CD4+ T-cells is shown on the y axis. Pie charts summarize the data, and each slice corresponds to the proportion of virus-specific CD4+ T-cells positive for a given combination of T-cell functions. LTTS: long-term treated HIV-1 seroconverters; LTNPs: HIV-1 long-term non-progressors.
Figure 2
Figure 2. Flow cytometry profiles of HIV-1-specific CD8+ T-cells. (A
) Shown are two representative flow cytometry profiles of HIV-1-specific CD8+ T-cell responses from two LTTS subjects: left panels from subject #LED-020 (stimulation with a gp41 epitope, aa 46–54) and right panels from subject #GOV-005 (stimulation with a nef epitope, aa 73–82). (B) Shown are two representative flow cytometry profiles of HIV-1-specific CD8+ T-cell responses from two LTNP subjects: left panels from #DEN-015 (stimulation with a nef epitope, aa 116–124) and right panels from #AAC-002 (stimulation with a p24 epitope, aa 162–172). IL-2, TNF-α and IFN-γ production was measured upon 6 hours of in vitro stimulation with optimal HIV-1 peptides. LTTS: long-term treated HIV-1 seroconverters; LTNPs: HIV-1 long-term non-progressors.
Figure 3
Figure 3. Comparison of the magnitude of HIV-1-specific CD8+ T-cell responses between LTTS and LTNPs.
Cumulative data (mean±SE) of the percentage of IFN-γ-, IL-2- and TNF-α-producing HIV-1 specific CD8+ T-cells following 6 hours of in vitro stimulation with optimal CD8+ T-cell HIV-1 peptides (A) or with optimal CD8+ T-cell Gag-derived peptides (B). LTTS: long-term treated HIV-1 seroconverters; LTNPs: HIV-1 long-term non-progressors.
Figure 4
Figure 4. Functional cytokine profile of HIV-1-specific CD8+ T-cells.
(A) Cumulative data of the simultaneous analysis of IFN-γ, IL-2 and TNF-α production. All possible combinations of IFN-γ, IL-2 and TNF-α production are shown on the x axis, whereas the percentage of the distinct cytokine-producing cell subsets within HIV-specific CD8+ T-cells is shown on the y axis. Pie charts (B) summarize the data and each slice corresponds to the proportion of HIV-1 specific CD8+ T-cells positive for a given combination of T-cell functions. (C) Per subject analysis of the proportion of CD8+ T-cells producing simultaneously 3 cytokines (IFN-γ + IL-2 + TNF-α). All the responses identified are shown per subject and the mean of responses is shown in red for each subject. Results from only 19 out of 20 LTTS subjects are shown as CD8+ T-cell responses to optimal epitopes were not identified in one subject, even though CD4+ and CD8+ T-cell responses upon stimulation with Gag peptide pool were detected. LTTS, long-term treated HIV-1 seroconverters; LTNPs: HIV-1 long-term non-progressors.
Figure 5
Figure 5. Analysis of HIV-1-specific CD8+ T-cell polyfunctionality.
Cumulative data of the analysis of simultaneous IFN-γ, IL-2 and TNF-α production comparing CD8+ T-cell responses targeting distinct viral regions (A), targeting ‘favourable vs. ‘other than favourable’ epitopes (B), restricted by HLA-B vs. HLA-A or -C alleles (C) and restricted by HLA class I alleles associated with slow disease progression (‘protective’) vs. all others HLA class I alleles (D). All possible combinations of IFN-γ, IL-2 and TNF-α production are shown on the x axis, whereas the percentage of each cytokine-producing cell subset within HIV-specific CD8+ T-cells is shown on the y axis. Only significant differences of a given virus-specific CD8+ T-cell response versus all others are shown. + denotes a P value <0.05. Pie charts summarize the data, and each slice corresponds to the proportion of virus-specific CD8+ T-cells positive for a given combination of T-cell functions. LTTS: long-term treated HIV-1 seroconverters; LTNPs: HIV-1 long-term non-progressors.
Figure 6
Figure 6. HIV-1-specific CD8+ T-cell perforin expression in LTTS and LTNPs.
(A) Representative flow cytometric plots of perforin vs. IFN-γ, TNF-α and IL-2 expression are shown from one representative LTTS subject upon 6 hours in vitro stimulation with a Nef epitope, aa 73–82. (B) Cumulative data of the simultaneous analysis of perforin, IFN-γ, IL-2 and TNF-α expression. All possible combinations of perforin, IFN-γ, IL-2 and TNF-α expression are shown on the x axis, whereas the percentage of the various marker-expressing cell subsets within HIV-1 specific CD8+ T-cells is shown on the y axis. Only significant differences of a given virus-specific CD8+ T-cell response versus all the others are shown. + denotes a P value<0.05. Pie charts summarize the data, and each slice corresponds to the proportion of virus-specific CD8+ T-cells positive for a certain combination of T-cell functions. LTTS: long-term treated HIV-1 seroconverters; LTNPs: HIV-1 long-term non-progressors.

References

    1. Kovacs A, Connors M. HIV-1 and immune control: can we change the course of HIV-1? Lancet. 2004;363:833–834. - PubMed
    1. Kaufmann GR, Zaunders JJ, Cunningham P, Kelleher AD, Grey P, et al. Rapid restoration of CD4 T cell subsets in subjects receiving antiretroviral therapy during primary HIV-1 infection. Aids. 2000;14:2643–2651. - PubMed
    1. Chun TW, Davey RT, Jr, Engel D, Lane HC, Fauci AS. Re-emergence of HIV after stopping therapy. Nature. 1999;401:874–875. - PubMed
    1. McMichael AJ, Rowland-Jones SL. Cellular immune responses to HIV. Nature. 2001;410:980–987. - PubMed
    1. Pantaleo G, Koup RA. Correlates of immune protection in HIV-1 infection: what we know, what we don't know, what we should know. Nat Med. 2004;10:806–810. - PubMed

Publication types

MeSH terms