. 2011 Apr 5;6(4):e18171.
doi: 10.1371/journal.pone.0018171.

Spatial extent of charge repulsion regulates assembly pathways for lysozyme amyloid fibrils

Affiliations

Spatial extent of charge repulsion regulates assembly pathways for lysozyme amyloid fibrils

Shannon E Hill et al. PLoS One. .

Abstract

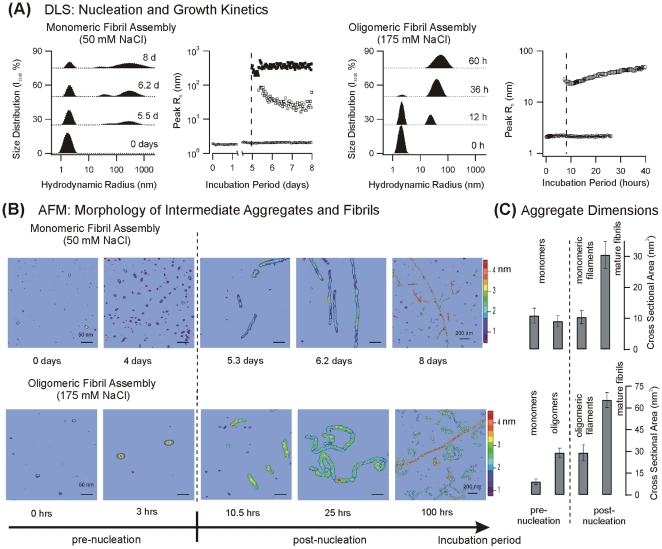
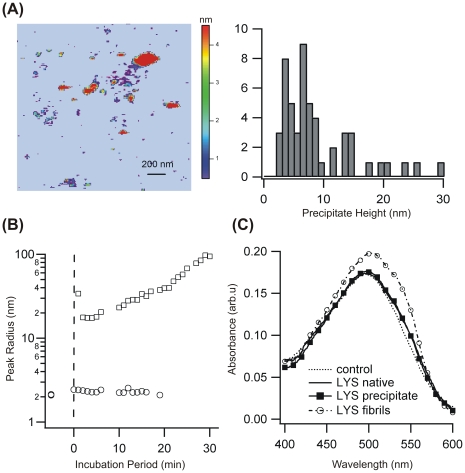
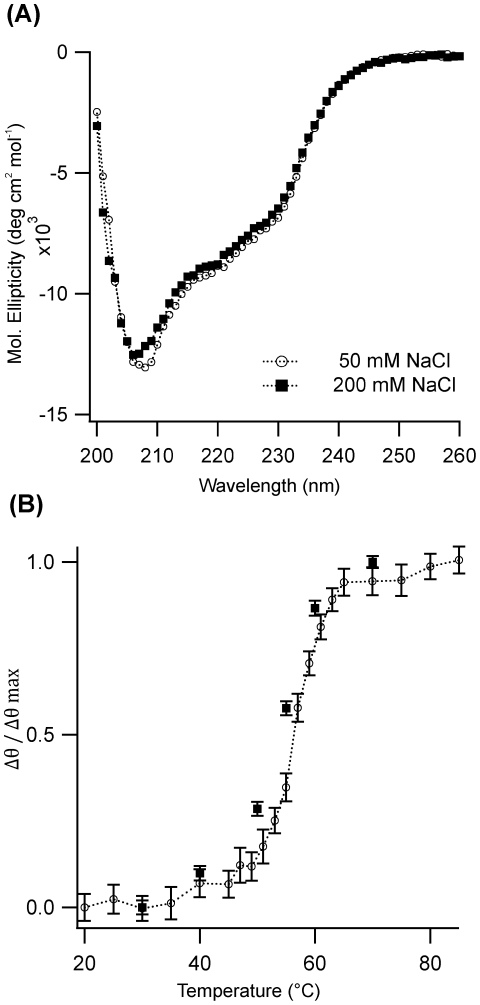
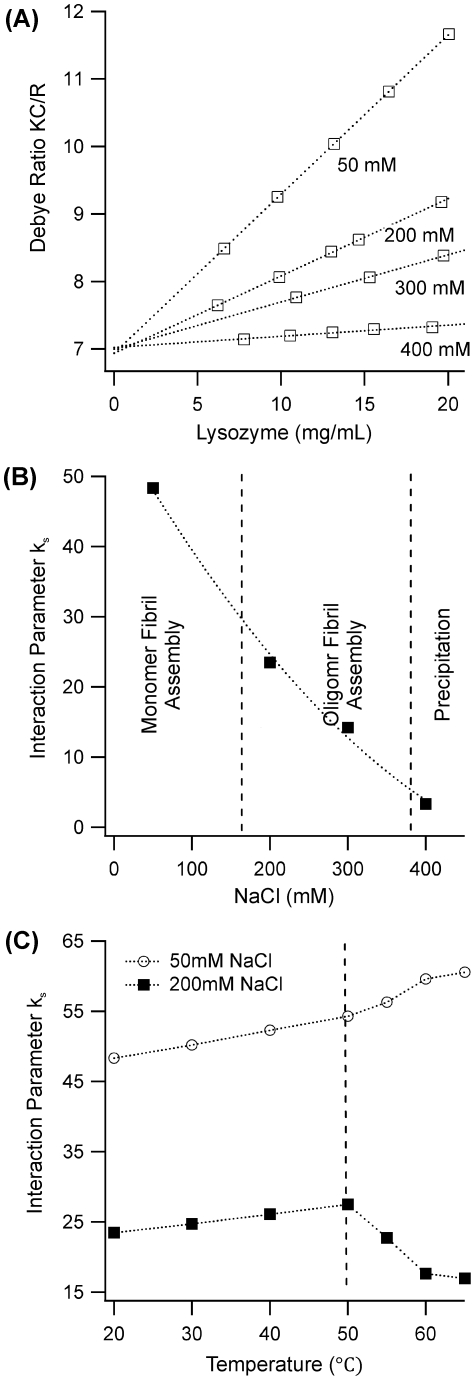
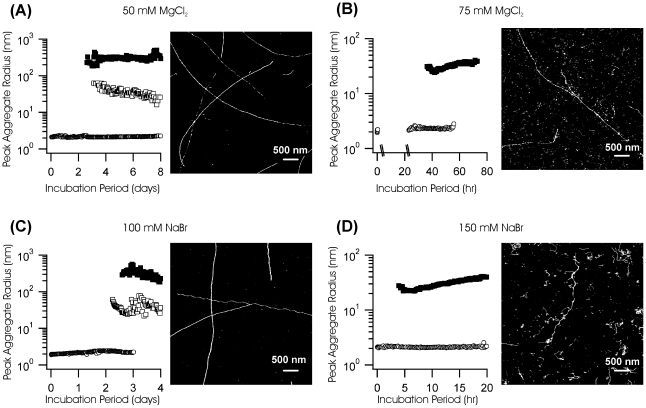
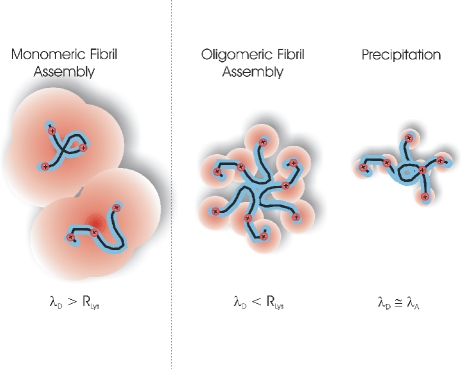
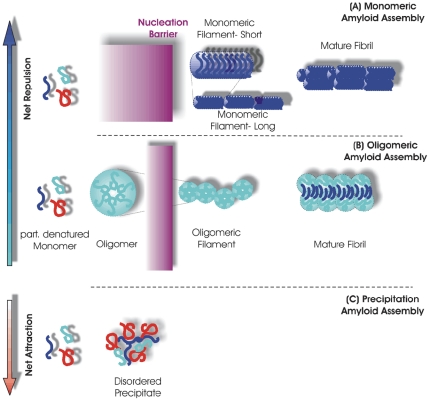
Formation of large protein fibrils with a characteristic cross β-sheet architecture is the key indicator for a wide variety of systemic and neurodegenerative amyloid diseases. Recent experiments have strongly implicated oligomeric intermediates, transiently formed during fibril assembly, as critical contributors to cellular toxicity in amyloid diseases. At the same time, amyloid fibril assembly can proceed along different assembly pathways that might or might not involve such oligomeric intermediates. Elucidating the mechanisms that determine whether fibril formation proceeds along non-oligomeric or oligomeric pathways, therefore, is important not just for understanding amyloid fibril assembly at the molecular level but also for developing new targets for intervening with fibril formation. We have investigated fibril formation by hen egg white lysozyme, an enzyme for which human variants underlie non-neuropathic amyloidosis. Using a combination of static and dynamic light scattering, atomic force microscopy and circular dichroism, we find that amyloidogenic lysozyme monomers switch between three different assembly pathways: from monomeric to oligomeric fibril assembly and, eventually, disordered precipitation as the ionic strength of the solution increases. Fibril assembly only occurred under conditions of net repulsion among the amyloidogenic monomers while net attraction caused precipitation. The transition from monomeric to oligomeric fibril assembly, in turn, occurred as salt-mediated charge screening reduced repulsion among individual charged residues on the same monomer. We suggest a model of amyloid fibril formation in which repulsive charge interactions are a prerequisite for ordered fibril assembly. Furthermore, the spatial extent of non-specific charge screening selects between monomeric and oligomeric assembly pathways by affecting which subset of denatured states can form suitable intermolecular bonds and by altering the energetic and entropic requirements for the initial intermediates emerging along the monomeric vs. oligomeric assembly path.


Conflict of interest statement

Competing Interests: The authors have declared that no competing interests exist.

Figures

Figure 1
Figure 1. Monomeric vs. Oligomeric Assembly Pathways for Lysozyme Amyloid Fibrils.
(A) In situ particle size distributions at different stages of growth and corresponding temporal evolution of the detected aggregate peaks during lysozyme fibril growth at 50 mM NaCl (left two panels) vs. 175 mM NaCl (right two panels), as obtained from dynamic light scattering measurements. The temporal evolution of the aggregate peak radii (1A panel 3&4) highlights the dramatic difference in lag periods (see vertical dashed line) and distinctly different nucleation signatures: Low-salt samples always yielded two peaks while only a single peak nucleated at elevated salt concentrations (B) Morphology of growth intermediates in the presence of 50 mM NaCl (top row) vs. 175 mM NaCl (bottom row), as observed with atomic force microscopy. The vertical dashed line separates samples taken before and after the nucleation event detected by DLS. The false color scale indicates the height of the different aggregates in nm. The scale bars represent 50 nm, except for the 200 nm scale bars in the last image in either series. AFM images and aggregate dimensions for the 175 mM data are adapted from our earlier work (Hill et al, 2009). They are representative of the behavior observed throughout the "intermediate" salt concentrations (150 mM to 350 mM) associated with the oligomeric assembly regime. (C) Cross sectional areas for the various aggregates in (B) measured with calibrated AFM tips. Note the distinctly different cross sections for aggregates along the two different assembly pathways. Top: Cross-sectional areas of monomers, monomeric filaments and mature lysozyme fibrils grown at 50 mM NaCl. At low salt, no globular oligomeric species are detected. The cross sections for monomers and monomeric filaments are identical then increase by a factor of three for mature fibrils. Bottom: At intermediate salt concentrations, ellipsoidal oligomers are formed well before the nucleation event seen in DLS. These oligomers have a volume close to eight monomers (see Table 1). The filaments emerging after nucleation have a cross section identical to that of the ellipsoidal oligomers. Late stage mature fibrils, in turn, had cross sectional areas close to two oligomeric filaments.
Figure 2
Figure 2. Distribution of Hydrodynamic Radii for Straight Monomeric Filaments: AFM vs. DLS.
Comparison of the hydrodynamic radii distributions obtained with AFM (shaded bins) vs. DLS (solid lines). For ease of comparison, filament lengths measured with AFM were converted into their corresponding hydrodynamic radii using established theoretical predictions for straight cylinders of variable length , and diameters close to monomeric filaments (4 nm) or mature fibrils (7 nm).
Figure 3
Figure 3. Precipitate Formation of Amyloidogenic Lysozyme.
(A) AFM image of precipitates and their corresponding height distributions observed shortly after the onset of aggregation. (B) DLS aggregate peaks of lysozyme in 400 mM NaCl before and right after partial denaturation of lysozyme (see vertical dashed line). (C) Congo Red spectra of native lysozyme (—) and lysozyme precipitates (▪) are indistinguishable. In contrast, mature fibrils grown at lower salt concentrations (open circles) induce the red shift and shoulder characteristic for binding to amyloid fibrils.
Figure 4
Figure 4. CD Spectroscopy and Thermal Denaturation of Lysozyme Monomers.
(A) Far uv CD spectra and (B) normalized thermal denaturation profile of lysozyme measured at 222 nm in either 50 mM (○) or 200 mM NaCl (▪).
Figure 5
Figure 5. Net Interactions among Native and Denatured Lysozyme Monomers.
(A) Debye plot of the static light scattering intensity (KC/R) vs. lysozyme concentration C at T = 20°C. The positive slope of these curves indicates that the interactions among the lysozyme monomers are predominately repulsive. This repulsion becomes screened out once NaCl concentrations reach about 400 mM. (B) Plot of the static interaction parameter ks (which is proportional to the slope of KCp/R vs. Cp) vs. salt concentration for the Data in A. The dotted line is a guide to the eye indicating how repulsion decreases with increasing salt concentration. The two dashed vertical lines mark the switch of lysozyme aggregation from monomeric (MF) to oligomeric fibril (OF) assembly and, eventually, precipitate formation (P). (C) Change in net interactions as lysozyme monomers undergo thermal denaturation in the presence of 50 mM (○) and 200 mM (▪) NaCl. The vertical dashed line indicates the onset of thermal denaturation at 50°C. Note that, the prevailing intermolecular interactions remain repulsive (positive Ks values) even after thermal denaturation. At the same time, denaturation at 50 mM NaCl makes lysozyme slightly more repulsive while the monomers become less repulsive following denaturation at 200 mM NaCl.
Figure 6
Figure 6. Lysozyme Fibril Growth in the Presence of MgCl2 vs NaBr.
DLS nucleation and growth kinetics (left panel) and corresponding AFM images of late-stage aggregates (right panel) for lysozyme amyloid fibrils grown in (A) 50 mM MgCl2, (B) 75 mM MgCl2 (C) 100 mM NaBr and (D) 150 mM NaBr.
Figure 7
Figure 7. Effects of Salt-mediated Charge Screening on Denatured Monomers.
The schematic indicates how the spatial extent (Debye screening length λD) of salt-mediated charge screening changes the character of the net interactions among denatured monomers and favors the formation of different aggregate geometries. The black curvy line represents the protein backbone while the blue perimeter symbolizes the short-range attractive protein interactions (hydrophobic, dipole-dipole, hydrogen bonding). Individual charged residues are represented by small positive spheres, and the extent of charge screening mediated by the salt ions is indicated as a red cloud surrounding the charge residues. At low salt concentrations, (monomeric assembly pathway) individual charges on the same monomer strongly repel each other and those on neighboring monomers. Only those few conformations of denatured monomers that can form intermolecular bonds similar to those in the native monomer are aggregation competent. In addition, charge repulsion among monomers will favor extended, polymeric structures for intermediates since that will separate the monomer charges from each other while preserving sufficient intermolecular contacts. When salt screening reduces λD below the separation of charged residues (oligomeric assembly pathway) along the monomer backbone, charge repulsion within a given monomer and, concurrently, among several aggregated monomers is significantly reduced. This favors the formation of more compact (oligomeric) aggregate assemblies and requires fewer monomers to share their hydrophobic cores to overcome the residual charge repulsion and loss in configurational entropy. Finally, when λD becomes comparable in range to the attractive interactions, the charge restrictions on "suitable" aggregate morphologies and favorable monomer conformation fall by the wayside and the denatured monomers precipitate randomly out of solution.
Figure 8
Figure 8. Schematic of Lysozyme Amyloid Assembly as Function of Net Intermolecular Interactions.
On the left side, the schematic indicates a collection of partially denatured monomers in different conformations. The relative distribution of denatured conformations will vary both with solution temperature and with the intramolecular interactions, which are affected by salt screening, as well. At the lowest salt concentration, charge repulsion suppresses the formation of compact oligomeric intermediates with their high local concentration of charge. Instead, the monomers have to form extended "short" monomeric filaments that spread out the net charge and which are held together by strong hydrogen cross-links (β-sheets). This process has a much higher nucleation barrier since many more monomers have to condense into the nucleus and the corresponding extended conformations of the denatured monomers are bound to be less frequently populated. Short monomeric filaments can assembly head-to-head into long monomeric filaments. These, in turn, can form mature fibrils via cross-assembly of three monomeric filaments. As salt concentration is increased (middle third of plot), lysozyme interactions become less repulsive. In this regime, monomers can assemble into oligomeric intermediates if they share their hydrophobic cores. This happens without apparent nucleation barrier. The nucleation step here is the formation of oligomeric filaments with, we suppose, partially overlapping core structures. These oligomeric filaments can form cross-links and restructure to form mature fibrils. At elevated salt concentrations (bottom third of plot), charge repulsion among the lysozyme monomers will be screened out and net intermolecular interactions become exclusively attractive. In this regime, monomers will undergo diffusion-limited aggregation and form random precipitates.

References

    1. Ross CA, Poirier MA. Protein aggregation and neurodegenerative disease. Nat Med. 2004;10:S10–S17. - PubMed
    1. Lansbury PT, Lashuel HA. A century-old debate on protein aggregation and neurodegeneration enters the clinic. Nature. 2006;443:774. - PubMed
    1. Koo EH, Landsbury PTJ, Kelly JW. Amyloid diseases: abnormal protein aggregation in neurodegeneration. P Natl Acad Sci U S A. 1999;96:9989–9990. - PMC - PubMed
    1. Chiti F, Dobson CM. Protein Misfolding, Functional Amyloid, and Human Disease. Annu Rev Biochem. 2006;75:333–366. - PubMed
    1. Kelly JW. Alternative conformations of amyloidogenic proteins govern their behavior. Curr Opin Struct Biol. 1996;6:11–17. - PubMed

Publication types