
Global human footprint on the linkage between biodiversity and ecosystem functioning in reef fishes

Camilo Mora et al. PLoS Biol. 2011 Apr.

Abstract

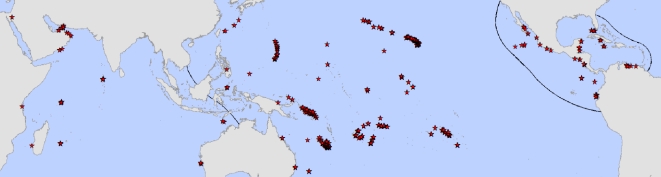
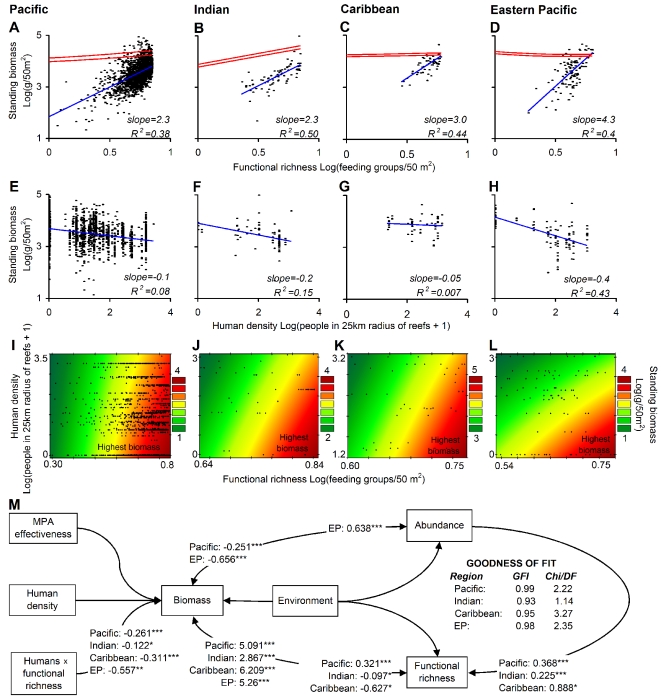
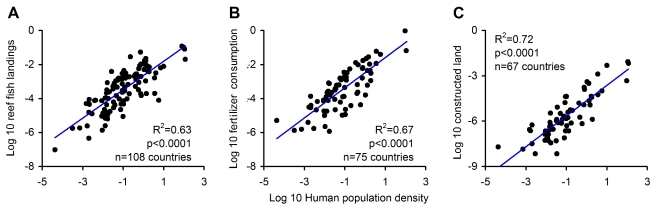
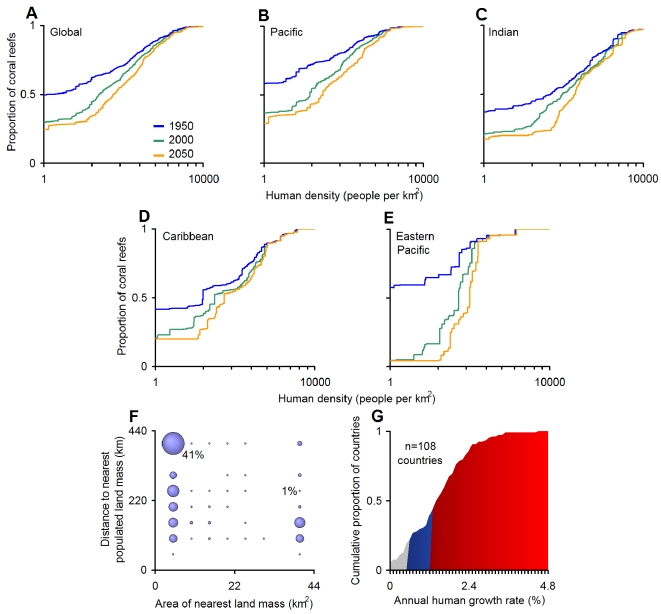
Difficulties in scaling up theoretical and experimental results have raised controversy over the consequences of biodiversity loss for the functioning of natural ecosystems. Using a global survey of reef fish assemblages, we show that in contrast to previous theoretical and experimental studies, ecosystem functioning (as measured by standing biomass) scales in a non-saturating manner with biodiversity (as measured by species and functional richness) in this ecosystem. Our field study also shows a significant and negative interaction between human population density and biodiversity on ecosystem functioning (i.e., for the same human density there were larger reductions in standing biomass at more diverse reefs). Human effects were found to be related to fishing, coastal development, and land use stressors, and currently affect over 75% of the world's coral reefs. Our results indicate that the consequences of biodiversity loss in coral reefs have been considerably underestimated based on existing knowledge and that reef fish assemblages, particularly the most diverse, are greatly vulnerable to the expansion and intensity of anthropogenic stressors in coastal areas.


Conflict of interest statement

The authors have declared that no competing interests exist.

Figures

Figure 1
Figure 1. Sampled locations.
Red stars represent sample locations. Regions analyzed are separated with solid black lines.
Figure 2
Figure 2. Predictors of standing biomass in reef fishes.
(A–D) Plots showing the relationship between standing biomass and functional richness for each region. Plots are on a logarithmic scale because this produces better fit to the data (Table S3; see Figure S2 for plots with species richness and Figure S3 for plots controlling for abundance of individuals). Blue lines indicate the linear trend fitted to the data, while red lines indicate 95% confidence intervals around the mean trend line relating standing biomass and diversity as calculated from the null model described in the text (results based on 100 runs of such null model). (E–H) Plots depicting the relationship between standing biomass and human population density. (I–L) Plots outlining changes in standing biomass as calculated from estimates of its covariance with functional richness and human population density as predicted from the structural equation model shown in (M). Fitting the equation that predicts standing biomass from human population density and functional richness is superior to fitting a trend surface over the raw data, as the former accounts for other variables (Figure S5 shows fits to the raw data). Equations were fitted only over the range of values of the data collected, which are indicated with black dots. (M) Diagram showing the unstandardized covariance estimates for the relationships in the structural equation model run independently for each region. All variables were log-transformed. The goodness-of-fit metrics are shown inside (M). The best model for each region included the variables for which the unstandardized covariance estimates are shown. Statistical significance for all relationships is best assessed from the results of the structural equation model given the control of confounding factors. Significance of covariance estimates with critical ratios significant at p<0.0001 (***), p<0.001 (**), and p<0.01 (*) are indicated beside each estimate. Chi/DF, Chi-square divided by the degrees of freedom; EP, Eastern Pacific; GFI, goodness-of-fit index.
Figure 3
Figure 3. Surrogates for human population density near reefs.
To assess the likely mechanism mediating the effect of human population density on reef fish biomass, we analyzed the relationships between human density near reefs and (A) fishing, (B) nutrient loads, and (C) habitat alteration. Fishing was estimated from reef fish landings reported to the Food and Agriculture Organization (http://www.fao.org/fishery/statistics/software/fishstat). For each country with coral reefs, we averaged reef fish landings between the years 1997 and 2001. Reef fish stocks were discriminated by classifying each of 1,472 stocks reported to the Food and Agriculture Organization as reef- or non-reef-associated using the Internet and other sources (http://www.fishbase.org). Nutrient load was quantified as fertilizer consumption using data obtained from the World Development Indicators database (http://www.worldbank.org/data). Finally, habitat alteration was quantified as the area of modified land indicated in the Global Land Cover 2000 dataset (http://ies.jrc.ec.europa.eu/global-land-cover-2000). Technical note: For purposes of comparison all variables were standardized by country area and area of reef. To control for type I errors arising from standardizing data by a common factor, significance levels were calculated by Monte-Carlo simulation, in which the slopes of the plots were calculated for each of 10,000 iterations in which standardization was done with random country areas and reefs, and then determining the fraction of “random” slopes above the true slope .
Figure 4
Figure 4. Human habitation of the world's coral reefs.
Cumulative proportion of reefs located near human settlements (A) globally and (B–E) regionally. Data on coral reef areas were obtained from the Millennium Coral Reef Mapping Project (http://www.imars.usf.edu/MC/index.html; [37]). Plots in (A–F) are based on the division of the world's coral reefs into 5×5 km cells and the maximum human density occurring within a 50-km radius from the center of each cell. We used each country's growth rate between the years1950 and 2000 and that expected in 2050 under the United Nations Population Division World Population Prospects “medium variant” projection (see details at http://esa.un.org/unpp/) to calculate, for each reef cell, human density in 1950 and 2050, respectively. Plot in (F) depicts the proportion of the world's uninhabited coral reefs in the year 2000 (i.e., coral reef cells with zero humans within a 50-km radius) in terms of their distance to the closest human population center and the area of the nearest land. Plot in (G) describes current annual growth rates for countries with coral reefs as reported in the United Nations Population Division World Population Prospects (http://esa.un.org/unpp/). Growth rates that will cause doubling of human populations in >100, <100, and <50 years are shaded in grey, blue, and red, respectively.

References

    1. Diraiappah A. K, Naeem S. Millennium ecosystem assessment: ecosystems and human well-being: biodiversity synthesis. Washington (D.C.): World Resources Institute; 2005.
    1. Butchart S. H. M, Walpole M, Collen B, van Strien A, Scharlemann J. P. W, et al. Global biodiversity: indicators of recent declines. Science. 2010;328:1164–1168. - PubMed
    1. Chapin F. S, Zavaleta E. S, Eviner V. T, Naylor R. L, Vitousek P. M, et al. Consequences of changing biodiversity. Nature. 2000;405:234–424. - PubMed
    1. Loreau M, Naeem S, Inchausti P, Bengtsson J, Grime J. P, et al. Biodiversity and ecosystem functioning: current knowledge and future challenges. Science. 2001;294:804–808. - PubMed
    1. Cardinale B. J, Srivastava D. S, Duffy J. E, Wright J. P, Downing A. L, et al. Effects of biodiversity on the functioning of trophic groups and ecosystems. Nature. 2006;443:989–992. - PubMed

Publication types