

The Driving Force of the Na/Ca-Exchanger during Metabolic Inhibition
- PMID: 21483726
- PMCID: PMC3070476
- DOI: 10.3389/fphys.2011.00010
The Driving Force of the Na/Ca-Exchanger during Metabolic Inhibition
Abstract
Objective: Metabolic inhibition causes a decline in mechanical performance and, if prolonged, myocardial contracture and cell death. The decline in mechanical performance is mainly due to altered intracellular calcium handling, which is under control of the Na(+)/Ca(2+)-exchanger (NCX) The driving force of the NCX (ΔG(ncx)) determines the activity of NCX. The aim of this study was to describe the relation between ΔG(ncx) and calcium homeostasis during metabolic inhibition.
Methods: In left ventricular rabbit myocytes, during metabolic inhibition (2 mmol/L sodium cyanide), sodium ([Na(+)](i)), calcium ([Ca(2+);](i)), and action potentials were determined with SBFI, indo-1, and the patch clamp technique. Changes of ΔG(ncx) were calculated.
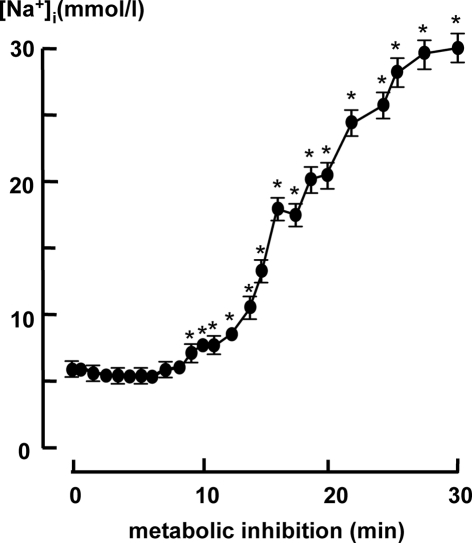
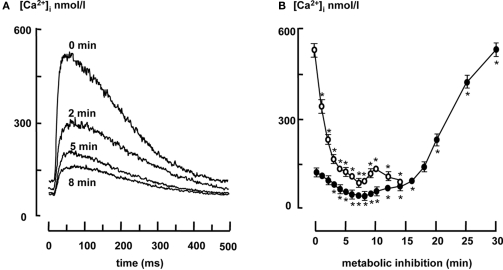
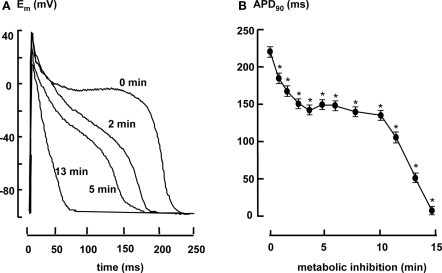
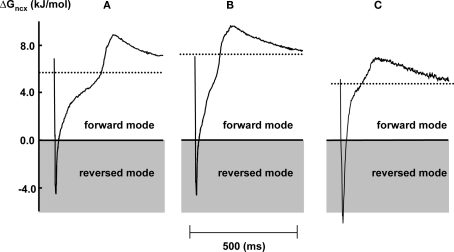
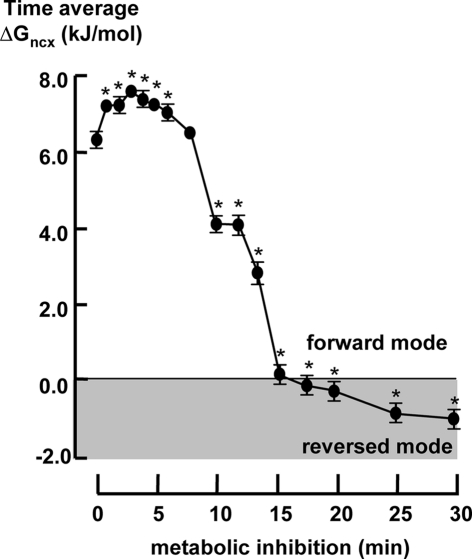
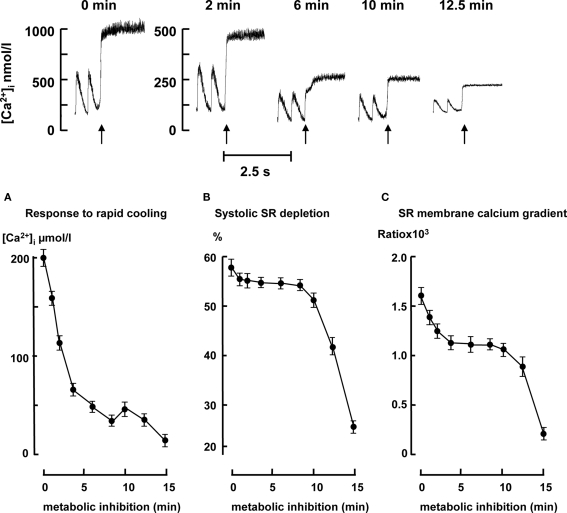
Results: During metabolic inhibition: The first 8 min [Na(+)](i) remained constant, systolic calcium decreased from 532 ± 28 to 82 ± 13 nM, diastolic calcium decreased from 121 ± 12 to 36 ± 10 nM and the sarcoplasmic reticulum (SR) calcium content was depleted for 85 ± 3%. After 8 min [Na(+);](i) and diastolic calcium started to increase to 30 ± 1.3 mmol/L and 500 ± 31 nM after 30 min respectively. The action potential duration shortened biphasically. In the first 5 min it shortened from 225 ± 12 to 153 ± 11 ms and remained almost constant until it shortened again after 10 min. After 14 min action potential and calcium transients disappeared due to unexcitability of the myocytes. This resulted in an increased of the time average of ΔG(ncx) from 6.2 ± 0.2 to 7.7 ± 0.3 kJ/mol during the first 3 min, where after it decreased and became negative after about 15 min.
Conclusion: Metabolic inhibition caused an early increase of ΔG(ncx) caused by shortening of the action potential. The increase of ΔG(ncx) contributed to decrease of diastolic calcium, calcium transient amplitude, SR calcium content, and contractility. The increase of diastolic calcium started after ΔG(ncx) became lower than under aerobic conditions.
Keywords: Na/Ca-exchanger; SR; action potential; calcium; driving force; metabolic inhibition; myocytes; sodium.
Figures
References
-
- Altamirano J., Bers D. M. (2007). Effect of intracellular Ca2+ and action potential duration on L-type Ca2+ channel inactivation and recovery from inactivation in rabbit cardiac myocytes. Am. J. Physiol. 293, H563–H573 - PubMed
-
- Baartscheer A., Schumacher C. A., Fiolet J. W. T. (1997). Small changes of cytosolic sodium in rat ventricular myocytes measured with SBFI in emission ratio mode. J. Mol. Cell. Cardiol. 29, 3375–3383 - PubMed
-
- Baartscheer A., Schumacher C. A., Fiolet J. W. T. (1998). Cytoplasmic sodium, calcium and free energy change of the Na+/Ca2+-exchanger in rat ventricular myocytes. J. Mol. Cell. Cardiol. 30, 2437–2447 - PubMed
LinkOut - more resources
Full Text Sources
Research Materials
Miscellaneous