

Genome-wide footprints of pig domestication and selection revealed through massive parallel sequencing of pooled DNA
- PMID: 21483733
- PMCID: PMC3070695
- DOI: 10.1371/journal.pone.0014782
Genome-wide footprints of pig domestication and selection revealed through massive parallel sequencing of pooled DNA
Abstract
Background: Artificial selection has caused rapid evolution in domesticated species. The identification of selection footprints across domesticated genomes can contribute to uncover the genetic basis of phenotypic diversity.
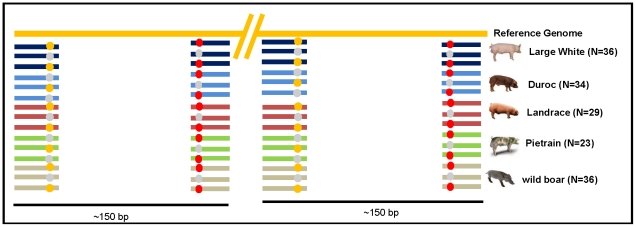
Methodology/main findings: Genome wide footprints of pig domestication and selection were identified using massive parallel sequencing of pooled reduced representation libraries (RRL) representing ∼2% of the genome from wild boar and four domestic pig breeds (Large White, Landrace, Duroc and Pietrain) which have been under strong selection for muscle development, growth, behavior and coat color. Using specifically developed statistical methods that account for DNA pooling, low mean sequencing depth, and sequencing errors, we provide genome-wide estimates of nucleotide diversity and genetic differentiation in pig. Widespread signals suggestive of positive and balancing selection were found and the strongest signals were observed in Pietrain, one of the breeds most intensively selected for muscle development. Most signals were population-specific but affected genomic regions which harbored genes for common biological categories including coat color, brain development, muscle development, growth, metabolism, olfaction and immunity. Genetic differentiation in regions harboring genes related to muscle development and growth was higher between breeds than between a given breed and the wild boar.
Conclusions/significance: These results, suggest that although domesticated breeds have experienced similar selective pressures, selection has acted upon different genes. This might reflect the multiple domestication events of European breeds or could be the result of subsequent introgression of Asian alleles. Overall, it was estimated that approximately 7% of the porcine genome has been affected by selection events. This study illustrates that the massive parallel sequencing of genomic pools is a cost-effective approach to identify footprints of selection.
Conflict of interest statement
Figures
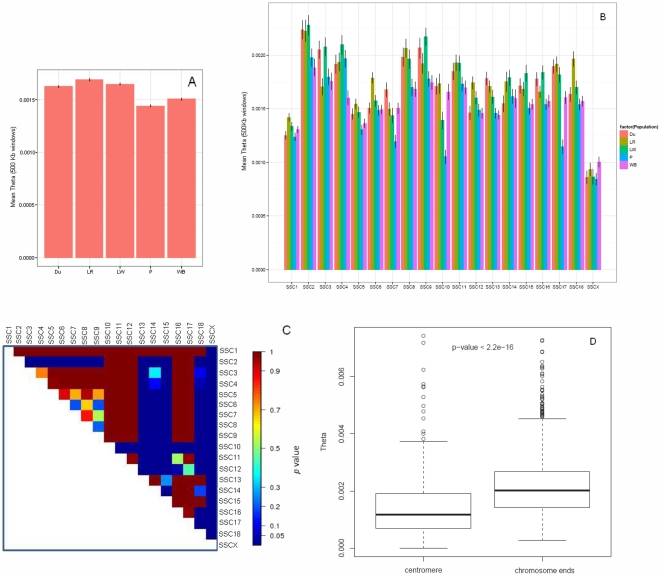
 ). A- Average
  overall chromosomes per population. B- Average
  per chromosome for each population. Vertical lines represent standard errors of the mean. C- Heatmap representing the p-values obtained from comparing the average
  per chromosome. D- Boxplot showing that centromeres and chromosome ends behave different in terms of nucleotide diversity.
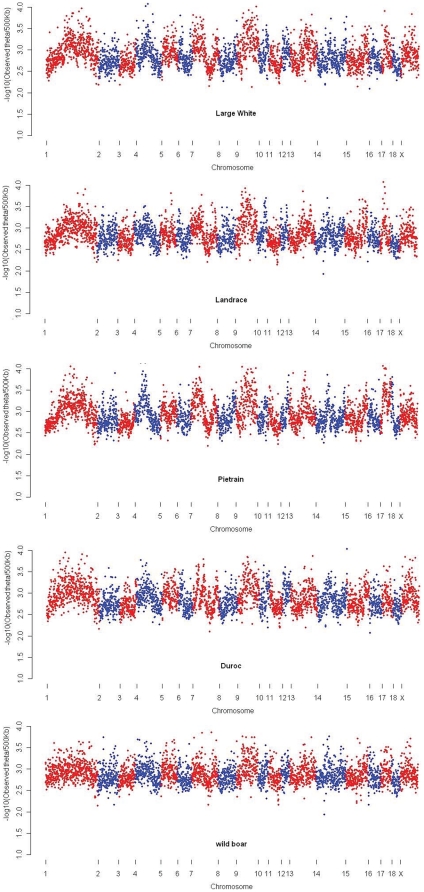
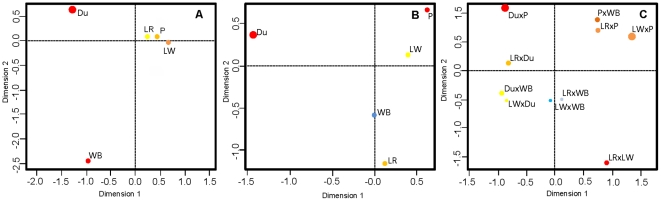
 smaller than the lowest 95% C.I. boundary); B- HT regions (regions with
  larger than the highest 95% C.I. boundary); C- Genomic regions with significant high Fst values. Different color and point size indicate the relative contribution of each population to the space arrangement in the plot. Brown color and larger size indicates highest contribution, light blue and smaller size indicates smallest contribution.
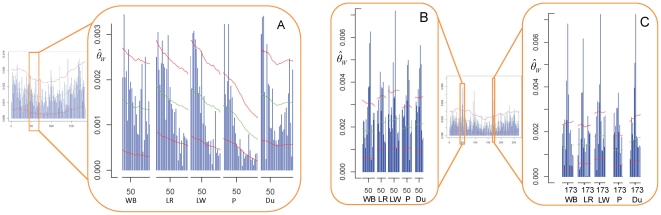
 per window. The insets are enlargements of the orange boxes that show details of the variation of
  in genomic regions that deviate from the standard neutral model in all sampled populations. A- Detail of genomic regions with a significantly low
  and that potentially contains the KIT gene. B- Detail of genomic regions with a significantly high
  and that potentially contains the TRIM26 gene member of the SLA locus. C- Detail of genomic regions with a significantly low
  and that potentially contains the OR4K13 gene.
References
-
- Price EO. Behavioral development in animals undergoing domestication. Applied Animal Behaviour Science. 1999;65:245–271. Available: http://www.sciencedirect.com/science/article/B6T48-3Y8VGSS-4/2/7be985b99.... Accessed 2009 July 23.
-
- Price EO, King J. Domestication and adaptation. In: Hafez, editor. Adaptation of domestic animals. Lea and Febiger; 1969. pp. 34–45.
-
- Van Laere AS, Nguyen M, Braunschweig M, Nezer C, Collette C, et al. A regulatory mutation in IGF2 causes a major QTL effect on muscle growth in the pig. Nature. 2003;425:832–836. Available: http://dx.doi.org/10.1038/nature02064. Accessed 2009 August 4. - DOI - PubMed
-
- Marklund S, Kijas J, Rodriguez-Martinez H, Rönnstrand L, Funa K, et al. Pigs with the dominant white coat color phenotype carry a duplication of the KIT gene encoding the mast/stem cell growth factor receptor. Mammalian Genome. 1996;7:822–830. Available: http://dx.doi.org/10.1007/s003359900244. Accessed 2009 June 14. - DOI - PubMed
-
- Fang M, Larson G, Ribeiro HS, Li N, Andersson L. Contrasting Mode of Evolution at a Coat Color Locus in Wild and Domestic Pigs. Plos Genetics. 2009;5:e1000341. Available: http://www.plosgenetics.org/article/info%3Adoi%2F10.1371%2Fjournal.pgen..... Acessed 2009 June 4. - PMC - PubMed
