. 2011 Apr 4;6(4):e18135.
doi: 10.1371/journal.pone.0018135.

Identification of common differentially expressed genes in urinary bladder cancer

Affiliations

Identification of common differentially expressed genes in urinary bladder cancer

Apostolos Zaravinos et al. PLoS One. .

Abstract

Background: Current diagnosis and treatment of urinary bladder cancer (BC) has shown great progress with the utilization of microarrays.

Purpose: Our goal was to identify common differentially expressed (DE) genes among clinically relevant subclasses of BC using microarrays.

Methodology/principal findings: BC samples and controls, both experimental and publicly available datasets, were analyzed by whole genome microarrays. We grouped the samples according to their histology and defined the DE genes in each sample individually, as well as in each tumor group. A dual analysis strategy was followed. First, experimental samples were analyzed and conclusions were formulated; and second, experimental sets were combined with publicly available microarray datasets and were further analyzed in search of common DE genes. The experimental dataset identified 831 genes that were DE in all tumor samples, simultaneously. Moreover, 33 genes were up-regulated and 85 genes were down-regulated in all 10 BC samples compared to the 5 normal tissues, simultaneously. Hierarchical clustering partitioned tumor groups in accordance to their histology. K-means clustering of all genes and all samples, as well as clustering of tumor groups, presented 49 clusters. K-means clustering of common DE genes in all samples revealed 24 clusters. Genes manifested various differential patterns of expression, based on PCA. YY1 and NFκB were among the most common transcription factors that regulated the expression of the identified DE genes. Chromosome 1 contained 32 DE genes, followed by chromosomes 2 and 11, which contained 25 and 23 DE genes, respectively. Chromosome 21 had the least number of DE genes. GO analysis revealed the prevalence of transport and binding genes in the common down-regulated DE genes; the prevalence of RNA metabolism and processing genes in the up-regulated DE genes; as well as the prevalence of genes responsible for cell communication and signal transduction in the DE genes that were down-regulated in T1-Grade III tumors and up-regulated in T2/T3-Grade III tumors. Combination of samples from all microarray platforms revealed 17 common DE genes, (BMP4, CRYGD, DBH, GJB1, KRT83, MPZ, NHLH1, TACR3, ACTC1, MFAP4, SPARCL1, TAGLN, TPM2, CDC20, LHCGR, TM9SF1 and HCCS) 4 of which participate in numerous pathways.

Conclusions/significance: The identification of the common DE genes among BC samples of different histology can provide further insight into the discovery of new putative markers.


Conflict of interest statement

Competing Interests: The authors have declared that no competing interests exist.

Figures

Figure 1
Figure 1. T2-Grade III tumors exhibited the strongest immunostaining for anti-cerbB2 (+++, >70%), anti-Ki67 (>70%) and anti-p53 (85%).
On the other hand, T1-Grade II tumors showed intense staining for anti-Cyclin D1 (80%), whereas T1-Grade III tumors exhibited weak immunostaining. Representative H&E slides denote the histology of T1-Grade II, T1-Grade III and T2-Grade III tumors.
Figure 2
Figure 2. Hierarchical clustering with Euclidean distance revealed groups of genes of common and differential expression.
Figure 3
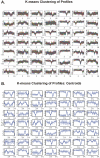
Figure 3. K-means clustering of all genes and all individual samples.
K-means cluster gave some distinct patterns among samples, such as in clusters 1, 3, 4, 5, etc.
Figure 4
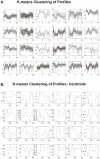
Figure 4. K-means clustering of common DE genes among all samples.
Clusters (A) and centroids (B) are presented where no clear distinction can be made between individual samples.
Figure 5
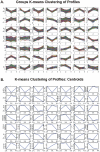
Figure 5. K-means clusters (A) and respective centroids (B) of tumor groups: T1-Grade II, T1-Grade III and T2/T3-Grade III.
Figure 6
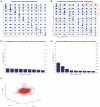
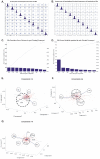
Figure 6. PCA analysis of genes was performed in order to find further patterns in the expression data.
The first step to perform the present analysis with all genes and in all samples was to plot scatter plots of all combinations of principal components (A, B). Genes manifested several patterns as it is seen in the circled areas in B. Then, samples were examined for the percentage of variance they attributed to the principal components (C, D). Finally, a biplot was drawn on order to examine sample classification with respect total gene expression (E). As it is presented in the circled areas in E, samples were grouped into two main categories: samples 22A (pT2- pT3-Grade III), 27A (pT1-Grade III) and 29A (pT2- pT3-Grade III).
Figure 7
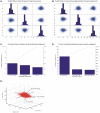
Figure 7. PCA analysis of common DE genes.
Scatter plots of principal components (A, B) are presented. Sample 2A attributes the observed variance (D). Plotting of the components showed different groupings among samples as it is shown in E, F, G.
Figure 8
Figure 8. PCA analysis of tumor groups.
Scatter plots of principal components are presented (A, B), observed variance (C, D) and biplot classification of tumor groups with respect to principal components (E).
Figure 9
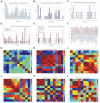
Figure 9. Chromosome distribution of common differentially expressed genes.
Common genes between all samples (A) showed peaks of gene expression in chromosome 1, 11 and 19. Down-regulated genes (B) showed peaks of gene expression in chromosome 1 and 11. Up-regulated genes (C) showed a peak in chromosomes 1 and 7. In concordance gene expression manifested a peak in chromosome 19 for common DE genes between groups pT1-Grade II (group I) and pT2- pT3-Grade III (group III) (D), while chromosome X appeared to express most of genes between down-regulated genes in group pT1-Grade III (group II) and simultaneously in up-regulated genes in group pT2- pT3-Grade III (group III) (E). The median expression of all samples with respect to chromosomes is presented in (F) (numbers above and below bars indicate the chromosome). It appeared that the most active chromosome is chromosome 9 for all tumor samples while controls manifest maximum median activity at chromosome 10 and X. Correlation maps for all chromosomes has revealed some patterns within chromosomes 1 (G), 4 (H), 8 (I), 13 (J), 21 (K), 22 (L). Especially on chromosome 4 it appeared that there is both negative as well as positive co-expression for the majority of the tumor samples.
Figure 10
Figure 10. Thirty-one percent (30.94%) of genes were attributed to Biological Process.
Within biological processes (A) genes for growth (B), metabolism (C) and development (D) were selected. Dendrograms (DAG trees) of Gene Ontology analysis of known differentially expressed genes in all combinations as they are presented in Table S5 was performed. Interestingly, common up-regulated genes were attributed to RNA processing and metabolism (G). The results include those combinations that have manifested significant function annotations at the p<0.05 level.
Figure 11
Figure 11. Hierarchical clustering (HCL) of between all control and all tumor samples, both considered as two separate groups.
HCL made distinctions between the different platforms, indicating that the DE genes were adequate to do such a classification. Hence, similarities from this group would be expected to be due to the tissues per se.
Figure 12
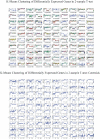
Figure 12. K-means clustering of DE genes between all tumor groups and all control samples.
Figure 13
Figure 13. CDC20 expression across all samples.
Apart from 9 samples, the gene appeared to be up-regulated in the rest 120 samples.
Figure 14
Figure 14. LHCGR expression (A) and HCL of differentially expressed genes analyzed with one-sample z-test (B).
(C) K-means clustering of DE genes in Intra-experimental comparison. (D) centroids.
Figure 15
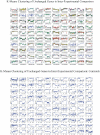
Figure 15. K-means clustering of unchanged genes in the inter-experimental comparison.
Figure 16
Figure 16. HCCS and TM9SF1 were simultaneously unchanged in the intra-experimental and differentially expressed in the inter-experimental comparisons.
Expression profiles of HCCS (A) and TM9SF1 (B).
Figure 17
Figure 17. Incidence of genes among predicted transcription factors.
The most prevalent gene was BMP4.
Figure 18
Figure 18. Average gene expression with respect to their corresponding chromosomes.
Figure 19
Figure 19. GO terms annotation of the common gene set.
Three functions could be outlined a) circulatory functions, b) reproductive organ development and catecholamine metabolism.
Figure 20
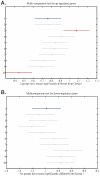
Figure 20. One-way ANOVA showed significant differences between samples 4A and 29A in up-regulated genes (A) while there were no significant differences in down-regulated genes (B) as both groups were mapped on chromosomes.

References

    1. Lopez-Beltran A, Montironi R. Non-invasive urothelial neoplasms: according to the most recent WHO classification. Eur Urol. 2004;46:170–176. - PubMed
    1. Golub TR, Slonim DK, Tamayo P, Huard C, Gaasenbeek M, et al. Molecular classification of cancer: class discovery and class prediction by gene expression monitoring. Science. 1999;286:531–537. - PubMed
    1. Khan J, Wei JS, Ringner M, Saal LH, Ladanyi M, et al. Classification and diagnostic prediction of cancers using gene expression profiling and artificial neural networks. Nat Med. 2001;7:673–679. - PMC - PubMed
    1. Perou CM, Sorlie T, Eisen MB, van de Rijn M, Jeffrey SS, et al. Molecular portraits of human breast tumours. Nature. 2000;406:747–752. - PubMed
    1. Alizadeh AA, Eisen MB, Davis RE, Ma C, Lossos IS, et al. Distinct types of diffuse large B-cell lymphoma identified by gene expression profiling. Nature. 2000;403:503–511. - PubMed

Publication types