

Parent-offspring transmission of adipocytokine levels and their associations with metabolic traits
- PMID: 21483749
- PMCID: PMC3070726
- DOI: 10.1371/journal.pone.0018182
Parent-offspring transmission of adipocytokine levels and their associations with metabolic traits
Abstract
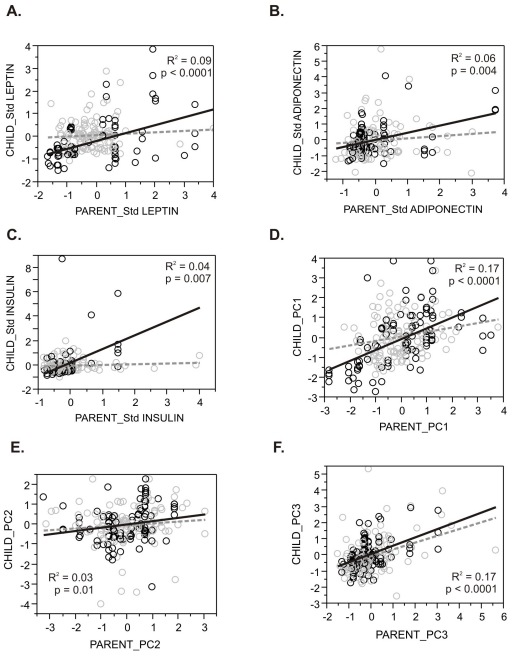
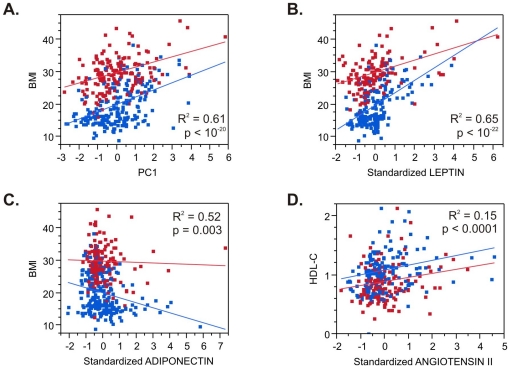
Adipose tissue secreted cytokines (adipocytokines) have significant effects on the physiology and pathology of human metabolism relevant to diabetes and cardiovascular disease. We determined the relationship of the pattern of these circulating hormones with obesity-related phenotypes and whether such pattern is transmitted from parent to offspring. A combined total of 403 individuals from 156 consenting Saudi families divided into initial (119 families with 123 adults and 131 children) and replication (37 families with 58 adults and 91 children) cohorts were randomly selected from the RIYADH Cohort study. Anthropometrics were evaluated and metabolic measures such as fasting serum glucose, lipid profiles, insulin, leptin, adiponectin, resistin, tumor necrosis factor alpha (TNFα), activated plasminogen activator inhibitor 1 (aPAI1), high sensitivity C-reactive protein (hsCRP) and angiotensin II were also assessed. Parent-offspring regressions revealed that with the exception of hsCRP, all hormones measured showed evidence for significant inheritance. Principal component (PC) analysis of standardized hormone levels demonstrated surprising heritability of the three most common axes of variation. PC1, which explained 21% of the variation, was most strongly loaded on levels of leptin, TNFα, insulin, and aPAI1, and inversely with adiponectin. It was significantly associated with body mass index (BMI) and phenotypically stronger in children, and showed a heritability of ∼50%, after adjustment for age, gender and generational effects. We conclude that adipocytokines are highly heritable and their pattern of co-variation significantly influences BMI as early as the pre-teen years. Investigation at the genomic scale is required to determine the variants affecting the regulation of the hormones studied.
Conflict of interest statement
Figures
References
-
- Ayatollahi SM, Ghoreshizadeh Z. Prevalence of obesity and overweight among adults in Iran. Obes Rev. 2010;11:335–337. - PubMed
-
- Lissner L, Sohlstrom A, Sundbloom E, Sjoberg A. Trends in overweight and obesity in Swedish schoolchildren 1999-2005: has the epidemic reached a plateau? Obes Rev. 2010;11:553–559. - PubMed
-
- Pearson S, Hansen B, Sorensen TI, Baker JL. Overweight and obesity trends in Copenhagen schoolchildren from 2002 to 2007. Acta Paediatr. 2010;99:1675–1678. - PubMed
Publication types
MeSH terms
Substances
LinkOut - more resources
Full Text Sources
Research Materials
Miscellaneous
