Comparative Study
. 2011 Apr 4;6(4):e18266.
doi: 10.1371/journal.pone.0018266.

Genome-wide expression profiling of five mouse models identifies similarities and differences with human psoriasis

Affiliations
Comparative Study

Genome-wide expression profiling of five mouse models identifies similarities and differences with human psoriasis

William R Swindell et al. PLoS One. .

Abstract

Development of a suitable mouse model would facilitate the investigation of pathomechanisms underlying human psoriasis and would also assist in development of therapeutic treatments. However, while many psoriasis mouse models have been proposed, no single model recapitulates all features of the human disease, and standardized validation criteria for psoriasis mouse models have not been widely applied. In this study, whole-genome transcriptional profiling is used to compare gene expression patterns manifested by human psoriatic skin lesions with those that occur in five psoriasis mouse models (K5-Tie2, imiquimod, K14-AREG, K5-Stat3C and K5-TGFbeta1). While the cutaneous gene expression profiles associated with each mouse phenotype exhibited statistically significant similarity to the expression profile of psoriasis in humans, each model displayed distinctive sets of similarities and differences in comparison to human psoriasis. For all five models, correspondence to the human disease was strong with respect to genes involved in epidermal development and keratinization. Immune and inflammation-associated gene expression, in contrast, was more variable between models as compared to the human disease. These findings support the value of all five models as research tools, each with identifiable areas of convergence to and divergence from the human disease. Additionally, the approach used in this paper provides an objective and quantitative method for evaluation of proposed mouse models of psoriasis, which can be strategically applied in future studies to score strengths of mouse phenotypes relative to specific aspects of human psoriasis.


Conflict of interest statement

Competing Interests: The authors have declared that no competing interests exist.

Figures

Figure 1
Figure 1. Psoriasiform phenotypes in the laboratory mouse.
The figure shows representative images of the five psoriasis-like phenotypes evaluated in this study (i.e., K5-Tie2, IMQ, K14-AREG, K5-Stat3C and K5-TGFβ1). Each mouse model exhibits red, scaly skin with macroscopic features suggestive of and consistent with clinical psoriasis in humans.
Figure 2
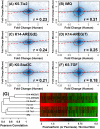
Figure 2. Global correspondence of gene expression between human psoriasis and mouse psoriasiform phenotypes.
The global correlation was evaluated between gene expression patterns in human psoriasis and those in psoriasiform plaques obtained from (A) K5-Tie2 transgenic mice (back skin), (B) IMQ-treated mice (back skin), (C) K14-AREG mice (ear skin) (D) K14-AREG mice (tail skin), (E) K5-Stat3C mice (back skin) and (F) K5-TGFβ1 mice (back skin). Scatterplots shown in (A) - (F) are each based upon 33322 matching transcripts associated with orthologous human and mouse genes. For each transcript, the difference was calculated between its average expression across psoriatic skin samples from n  =  58 patients and its average expression across normal skin samples from a group of n  =  64 healthy subjects. The horizontal axis corresponds to the ratio of gene expression in psoriatic skin relative to skin from control subjects (log2 scale), with values larger than one indicating increased expression in psoriatic skin. The vertical axis corresponds to the ratio of gene expression in mouse psoriasiform skin relative to skin samples from control mice (log2 scale). The intensity of the blue shading represents the empirical density of 33322 points within the bivariate space, and the dotted red line was generated by least-squares regression. The red circle shown in each figure outlines the set of transcripts (75% of all transcripts) that are closest to the bivariate centroid (based upon Mahalanobis distance). The Pearson correlation coefficient (r) calculated from each scatterplot is shown in the lower-right corner of (A) - (F). In panel (G), the human-mouse correspondence was evaluated with respect to a subset of 2617 transcripts elevated in human psoriasis and 3540 transcripts decreased in human psoriasis (FDR-adjusted P<0.05, log2-transformed fold-change estimate greater than 0.50 in absolute value). Colors denote the fold-change estimate associated with human or mouse transcripts (see scale), with red regions indicating elevated expression in psoriatic skin or mouse phenotypes (i.e., fold-change greater than one), and green indicating decreased expression in psoriatic skin or mouse phenotypes (i.e., fold-change less than one). The expression profiles shown in the heatmap have been clustered according to the Pearson correlation coefficient (see dendrogram on left).
Figure 3
Figure 3. Statistically significant correspondence between human psoriasis and mouse psoriasiform phenotypes: Proportion of psoriasiform-increased to psoriasiform-decreased transcripts.
Genes significantly increased or decreased in human psoriasis were identified and the expression of orthologous genes was studied in the K5-Tie2 phenotype (A and B), the IMQ phenotype (C and D), the K14-AREG phenotype on ear skin (E and F), the K14-AREG phenotype on tail skin (G and H), the K5-Stat3C phenotype (I and J), and the K5-TGFβ1 phenotype (K and L). We identified 793 transcripts with significantly elevated expression in human psoriasis (FDR-adjusted P<0.05 and log2-transformed fold-change estimate greater than 1.00), and these transcripts were associated with 981 transcripts derived from orthologous mouse genes. For these 981 mouse transcripts, the fold-change ratio was calculated between psoriasiform and normal mouse skin, and in figures A, C, E, G, I and K fold-change estimates have been ranked from smallest (left) to largest (right). Likewise, we identified 533 transcripts with significantly decreased expression in human psoriasis (FDR-adjusted P<0.05 and log2-transformed fold-change estimate less than 1.00 in absolute value), and these transcripts were associated with 709 transcripts derived from orthologous mouse genes. For these 709 transcripts, the fold-change ratio was calculated between psoriasiform skin and normal skin from control mice, and in figures B, D, F, H, J and L fold-change estimates have been ranked from smallest (left) to largest (right). In each figure, red symbols denote transcripts increased in psoriasiform mouse skin and green symbols denote transcripts decreased in psoriasiform skin. The dotted vertical line is equal to the number of psoriasiform-decreased transcripts, and the grey region corresponds to the random expectation, representing the 95% confidence limits associated with the null (hypergeometric) distribution. In figures A, C, E, G, I and K, there is a significant overabundance of psoriasiform-increased transcripts, because the dotted vertical line is left of the gray region. In figures B, D, F, H, J and L, there is a significant overabundance of psoriasiform-decreased transcripts, because the dotted vertical line is right of the gray region. Green and red percentage values shown in each figure indicate the percentage of psoriasiform-decreased and psoriasiform-increased transcripts, respectively.
Figure 4
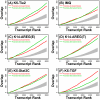
Figure 4. Statistically significant correspondence between human psoriasis and mouse psoriasiform phenotypes: Analysis of ranked gene lists.
The 5000 transcripts with expression most strongly elevated in human psoriasis were identified, along with the 5000 transcripts with expression most strongly decreased in human psoriasis. These transcripts were ranked according to the estimated fold-change expression ratio (psoriasis/control), with lower ranks assigned to transcripts most strongly increased or decreased in human psoriasis. For any rank N, where N = 1, …, 5000, we isolated the top N human transcripts and identified orthologous mouse transcripts, and then determined whether these mouse transcripts overlapped significantly with the top N mouse transcripts increased or decreased in the (A) K5-Tie2 phenotype, (B) IMQ phenotype, (C) K14-AREG phenotype on ear skin, (D) K14-AREG phenotype on tail skin, (E) K5-Stat3C phenotype and (F) K5-TGFβ1 phenotype. In each figure, the red line corresponds to the overlap, at a given rank N, between the top N psoriasiform-increased mouse transcripts and the set of mouse transcripts orthologous to the top N psoriasis-increased human transcripts. Similarly, the green line corresponds to the overlap, at a given rank N, between the top N psoriasiform-decreased mouse transcripts and the set of mouse transcripts orthologous to the top N psoriasis-decreased human transcripts. The grey region outlines the level of overlap expected by chance for any given rank N (i.e., the 95% confidence region of the null hypergeometric distribution). A significant level of overlap is indicated for each psoriasiform phenotype because red and green lines lie above the grey region that spans the null expectation.
Figure 5
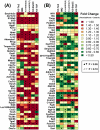
Figure 5. Trademark gene expression patterns of human psoriasis and expression of orthologous genes in mouse psoriasiform phenotypes.
Genome wide expression data from human psoriatic skin samples (n = 58 patients) and normal skin (n = 64 subjects) was analyzed to identify (A) the 50 genes most strongly increased in human psoriasis and (B) the 50 genes most strongly decreased in human psoriasis (both lists exclude any psoriasis-increased or psoriasis-decreased human gene that lacks an orthologous mouse gene). For each human gene, a matching transcript associated with an orthologous mouse gene was identified, and the expression of this mouse transcript was compared in psoriasiform (n = 3) and normal skin (n = 3). In part (A), mouse genes are listed in descending order according to the fold-change estimate calculated with respect to the human orthologue (psoriasis/control), such that transcripts orthologous to genes most strongly increased in human psoriasis are positioned near the top of the figure. In part (B), mouse genes are listed in ascending order according to the fold-change estimate calculated with respect to the human orthologue (psoriasis/control), such that transcripts orthologous to genes most strongly decreased in human psoriasis are positioned near the top of the figure. The colors in (A) and (B) correspond to the observed fold-change difference between expression in psoriasiform mouse skin and normal skin obtained from control mice, with red indicating elevated expression in psoriasiform skin and green indicating decreased expression (see scale). Filled up-triangles denote transcripts with significantly increased expression in psoriasiform mouse skin (P<0.05) and filled down-triangles denote transcripts with significantly decreased expression in psoriasiform mouse skin (P<0.05). Unfilled up or down triangles denote transcripts for which the expression difference between psoriasiform and control mouse skin was marginally significant (0.05≤ P <0.10).
Figure 6
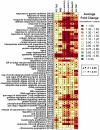
Figure 6. Gene ontology biological processes overrepresented among genes exhibiting increased expression in human psoriasis.
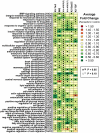
A total of 2617 transcripts were identified as significantly elevated in psoriatic plaques obtained from human patients relative to normal skin obtained from control subjects (FDR-adjusted P<0.05 and log2-transformed fold-change greater than 0.50). These psoriasis-increased transcripts were analyzed to identify gene ontology biological process terms significantly over-represented (P<0.05). For each over-represented term, we determined which of the 2617 transcripts were annotated with the term, and for these human transcripts, we identified a set of mouse transcripts associated with orthologous genes. For each mouse transcript within this set, we calculated the expression ratio between psoriasiform and normal mouse skin, and determined the average value of this ratio among all transcripts in the set. The analysis was repeated with respect to each of the mouse skin phenotypes. Colors in the chart reflect the average fold-change ratio (psoriasiform/control) of the set of mouse transcripts associated with the gene ontology term listed in each row (see scale). Triangle symbols indicate whether the average fold-change estimate associated with mouse transcripts is significantly different from one (see legend; two-sample t-test). The number of transcripts associated with each GO term is indicated in brackets (e.g., [x/y], where x denotes the number of human transcripts and y represents the number of mouse transcripts derived from orthologous genes). Since mouse transcripts included in this analysis were orthologous to genes exhibiting elevated expression in human psoriasis, correspondence between human psoriasis and mouse phenotypes is indicated by red colors and up-triangle symbols.
Figure 7
Figure 7. Gene ontology biological processes overrepresented among genes exhibiting decreased expression in human psoriasis.
A total of 3540 transcripts were identified as significantly decreased in psoriatic plaques obtained from human patients relative to normal skin obtained from control subjects (FDR-adjusted P<0.05 and log2-transformed fold-change less than -0.50). These psoriasis-decreased transcripts were analyzed to identify gene ontology biological process terms significantly over-represented (P<0.05). For each over-represented term, we determined which of the 3540 transcripts were annotated with the term, and for these human transcripts, we identified a set of mouse transcripts associated with orthologous genes. For each mouse transcript within this set, we calculated the expression ratio between psoriasiform and normal mouse skin, and determined the average value of this ratio among all transcripts in the set. The analysis was repeated with respect to the K5-Tie2 phenotype, IMQ phenotype, K14-AREG phenotype on ear skin, K14-AREG phenotype on tail skin, K5-Stat3C phenotype, and K5-TGFβ1 phenotype. Colors in the chart reflect the average fold-change ratio (psoriasiform/control) of the set of mouse transcripts associated with the gene ontology term listed in each row (see scale). Triangle symbols indicate whether the average fold-change estimate associated with mouse transcripts is significantly different from one (see legend; two-sample t-test). The number of transcripts associated with each GO term is indicated in brackets (e.g., [x/y], where x denotes the number of human transcripts and y represents the number of mouse transcripts derived from orthologous genes). Since mouse transcripts included in this analysis were orthologous to genes exhibiting decreased expression in human psoriasis, correspondence between human psoriasis and mouse phenotypes is indicated by green colors and down-triangle symbols.
Figure 8
Figure 8. Mouse orthologs of immune response genes increased in human psoriasis.
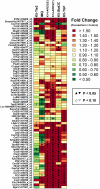
A total of 129 transcripts associated with “immune response” were significantly elevated in human psoriasis (GO:0006966). With respect to these 129 psoriasis-increased transcripts, we identified 128 corresponding mouse transcripts derived from orthologous mouse genes. A subset of these 128 transcripts is listed in the figure (left margin). The heat map image describes the response patterns of these transcripts in psoriasiform phenotypes relative to normal skin in control mice. Red colors correspond to increased expression in psoriasiform phenotypes and green colors correspond to decreased expression (see scale; right margin). Up- and down-triangles denote transcripts for which the fold-change difference between lesion and normal mouse skin is significant or marginally significant. Since listed transcripts are orthologous to human genes exhibiting increased expression in clinical psoriasis, correspondence to the human disease is denoted by red colors (i.e., increased expression in psoriasiform phenotypes).
Figure 9
Figure 9. Leukocyte infiltration signatures of human psoriasis and mouse psoriasiform lesions.
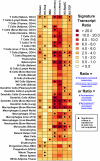
The immunophenotyping algorithm developed by Swindell et al. (31) was used to generate inflammation profiles for human psoriasis and the K5-Tie2, IMQ, K14-AREG, K5-Stat3C and K5-TGFβ1 psoriasiform lesions. Signature transcripts highly expressed within different cell populations were identified, where most cell populations were leukocyte subsets isolated from mice (e.g., T-cells, B cells, macrophages; see Methods for details). For each set of n signature transcripts associated with a given cell population, and for each psoriasiform phenotype, we identified the number of transcripts with increased expression in mouse psoriasiform lesions (n 1) and the number of transcripts with decreased expression in mouse psoriasiform lesions (n 2). For each set and each mouse phenotype, the ratio of psoriasiform-increased to psorisiform-decreased transcripts was calculated (i.e., ratio  =  n 1/n 2, where n 1 + n 2  =  n). Colors in the chart corresponds to this calculated ratio (see scale), where darker red colors indicate that the signature transcripts of cell populations (rows) tended to be elevated in the mouse psoriasiform phenotype (columns). Filled symbols are used to indicate cell populations for which the proportion of signature transcripts elevated in psoriasiform phenotypes (i.e., the n 1/n 2 ratio) was significantly large (see Methods for significance criteria). Darker colors (larger n 1/n 2 ratios) thus indicate cell populations that, based upon the observed gene expression patterns, appear likely to comprise the inflammatory infiltrate associated with a given mouse psoriasiform phenotype. In the first column, a similar methodology was applied with respect to human psoriasis. However, for each cell population, we identified human transcripts associated with genes orthologous to the n signature transcripts, and among these human transcripts, we evaluated the ratio of psoriasis-increased to psoriasis-decreased transcripts.
Figure 10
Figure 10. Gene expression signatures associated with cytokine stimulation and differentiation of keratinocytes (KCs).
Microarray data was used to identify human transcripts exhibiting increased or decreased expression in KCs treated with cytokines (e.g., TNF, IFN-α, IFN-γ), agents that induce differentiation (calcium (CA), KC growth factor (KGF)), and agents that inhibit differentiation (retinoic acid (RA)). Each row in the chart corresponds to a set of transcripts, with the number of human and associated mouse transcripts indicated in brackets (n  =  x/y denotes x human transcripts and y mouse transcripts associated with orthologous mouse genes). For human transcripts in each set, the average expression ratio between psoriasis and normal skin samples (psoriasis/normal) was calculated, and the average ratio obtained for each set is denoted in the first column according to the color code described in the legend. Likewise, for mouse transcripts within each set, the average expression ratio between psoriasiform and normal skin (psoriasiform/normal) was calculated with respect to each mouse model, and the average ratio value for each set and mouse model is indicated according to the color code (see legend). Triangle symbols indicate whether, on average, fold change estimates differ significantly from one (see legend; two-tailed t-test). In some cases (rows), gene sets were defined based upon data from Gene Expression Omnibus (GEO) and the GEO series identifier is given in parentheses (e.g., GSE7216).

References

    1. Conrad C, Boyman O, Tonel G, Tun-Kyi A, Laggner U, et al. Alpha1beta1 integrin is crucial for accumulation of epidermal T cells and the development of psoriasis. Nat Med. 2007;13:836–842. - PubMed
    1. Nickoloff BJ, Wrone-Smith T. Injection of pre-psoriatic skin with CD4+ T cells induces psoriasis. Am J Pathol. 1999;155:145–158. - PMC - PubMed
    1. Boehncke WH, Schön MP. Animal models of psoriasis. Clin Dermatol. 2007;25:596–605. - PubMed
    1. Gudjonsson JE, Johnston A, Dyson M, Valdimarsson H, Elder JT. Mouse models of psoriasis. J Invest Dermatol. 2007;127:1292–1308. - PubMed
    1. Nestle FO, Nickoloff BJ. Animal models of psoriasis: a brief update. J Eur Acad Dermatol Venereol. 2006;20:24–27.

Publication types

MeSH terms