Systematic detection of polygenic cis-regulatory evolution
- PMID: 21483757
- PMCID: PMC3069120
- DOI: 10.1371/journal.pgen.1002023
Systematic detection of polygenic cis-regulatory evolution
Abstract
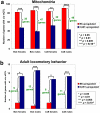
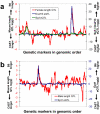
The idea that most morphological adaptations can be attributed to changes in the cis-regulation of gene expression levels has been gaining increasing acceptance, despite the fact that only a handful of such cases have so far been demonstrated. Moreover, because each of these cases involves only one gene, we lack any understanding of how natural selection may act on cis-regulation across entire pathways or networks. Here we apply a genome-wide test for selection on cis-regulation to two subspecies of the mouse Mus musculus. We find evidence for lineage-specific selection at over 100 genes involved in diverse processes such as growth, locomotion, and memory. These gene sets implicate candidate genes that are supported by both quantitative trait loci and a validated causality-testing framework, and they predict a number of phenotypic differences, which we confirm in all four cases tested. Our results suggest that gene expression adaptation is widespread and that these adaptations can be highly polygenic, involving cis-regulatory changes at numerous functionally related genes. These coordinated adaptations may contribute to divergence in a wide range of morphological, physiological, and behavioral phenotypes.
Conflict of interest statement
The authors have declared that no competing interests exist.
Figures


Similar articles
-
Polygenic cis-regulatory adaptation in the evolution of yeast pathogenicity.Genome Res. 2012 Oct;22(10):1930-9. doi: 10.1101/gr.134080.111. Epub 2012 May 29. Genome Res. 2012. PMID: 22645260 Free PMC article.
-
Polygenic Adaptation: Integrating Population Genetics and Gene Regulatory Networks.Trends Genet. 2021 Jul;37(7):631-638. doi: 10.1016/j.tig.2021.03.005. Epub 2021 Apr 21. Trends Genet. 2021. PMID: 33892958 Review.
-
Quantity, Not Quality: Rapid Adaptation in a Polygenic Trait Proceeded Exclusively through Expression Differentiation.Mol Biol Evol. 2017 Dec 1;34(12):3099-3110. doi: 10.1093/molbev/msx231. Mol Biol Evol. 2017. PMID: 28962003
-
cis-Regulatory changes in locomotor genes are associated with the evolution of burrowing behavior.Cell Rep. 2022 Feb 15;38(7):110360. doi: 10.1016/j.celrep.2022.110360. Cell Rep. 2022. PMID: 35172153
-
The evolutionary significance of cis-regulatory mutations.Nat Rev Genet. 2007 Mar;8(3):206-16. doi: 10.1038/nrg2063. Nat Rev Genet. 2007. PMID: 17304246 Review.
Cited by
-
Using genomics to characterize evolutionary potential for conservation of wild populations.Evol Appl. 2014 Nov;7(9):1008-25. doi: 10.1111/eva.12149. Epub 2014 Mar 14. Evol Appl. 2014. PMID: 25553064 Free PMC article.
-
Single-cell chromatin accessibility profiling reveals regulatory mechanisms and evolution in pig brains.BMC Biol. 2025 Jun 9;23(1):163. doi: 10.1186/s12915-025-02263-2. BMC Biol. 2025. PMID: 40490756 Free PMC article.
-
Genetic variants contribute to gene expression variability in humans.Genetics. 2013 Jan;193(1):95-108. doi: 10.1534/genetics.112.146779. Epub 2012 Nov 12. Genetics. 2013. PMID: 23150607 Free PMC article.
-
Cis-regulatory variants affect gene expression dynamics in yeast.Elife. 2021 Aug 9;10:e68469. doi: 10.7554/eLife.68469. Elife. 2021. PMID: 34369376 Free PMC article.
-
Gene regulation and speciation in house mice.Genome Res. 2016 Apr;26(4):451-61. doi: 10.1101/gr.195743.115. Epub 2016 Feb 1. Genome Res. 2016. PMID: 26833790 Free PMC article.
References
-
- Hoekstra HE, Coyne JA. The locus of evolution: Evo devo and the genetics of adaptation. Evolution. 2007;61:995–1016. - PubMed
-
- Fraser HB. Gene expression adaptation: from single genes to genomes. Bioessays, accepted for publication
-
- Wray GA. The evolutionary significance of cis-regulatory mutations. Nat Rev Genet. 2007;8:206. - PubMed
Publication types
MeSH terms
LinkOut - more resources
Full Text Sources
Molecular Biology Databases

