. 2011 Apr 1;6(4):e18518.
doi: 10.1371/journal.pone.0018518.

Low CD4/CD8 T-cell ratio associated with inflammatory arthropathy in human T-cell leukemia virus type I Tax transgenic mice

Affiliations

Low CD4/CD8 T-cell ratio associated with inflammatory arthropathy in human T-cell leukemia virus type I Tax transgenic mice

Takeo Ohsugi et al. PLoS One. .

Abstract

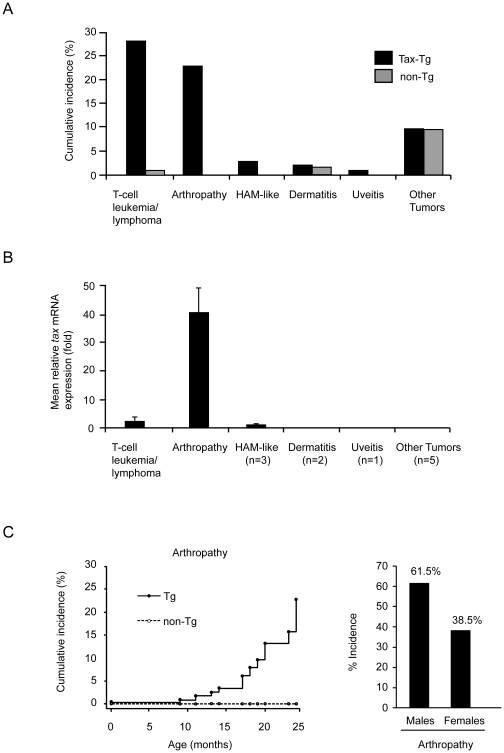
Background: Human T-cell leukemia virus type I (HTLV-1) can cause an aggressive malignancy known as adult T-cell leukemia/lymphoma (ATL) as well as inflammatory diseases such as HTLV-1-associated myelopathy/tropical spastic paraparesis (HAM/TSP). A transgenic mouse that expresses HTLV-1 Tax also develops T-cell leukemia/lymphoma and an inflammatory arthropathy that resembles rheumatoid arthritis. The aim of this study was to identify the primary T-cell subsets involved in the development of arthropathy in Tax transgenic mice.

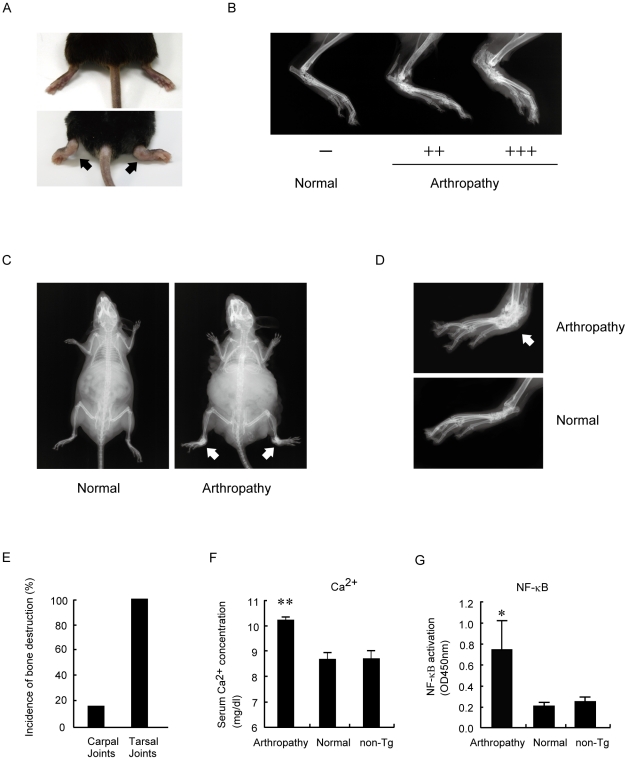
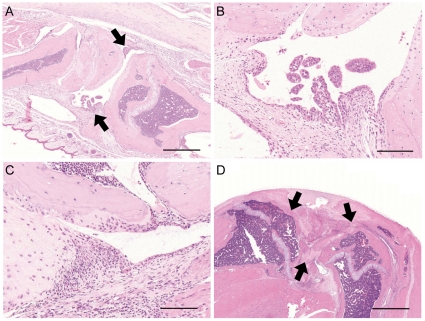
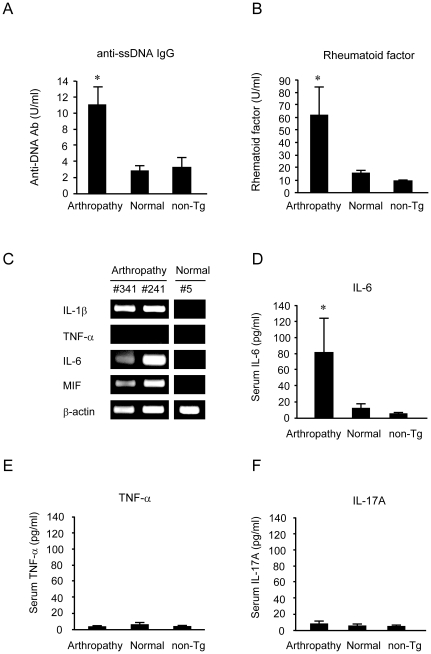
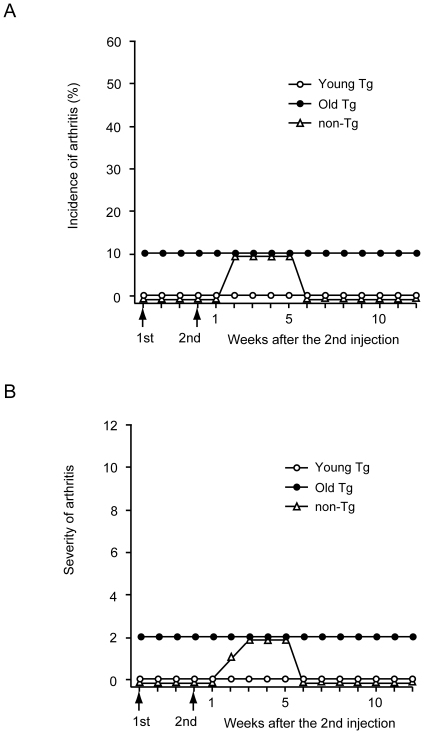
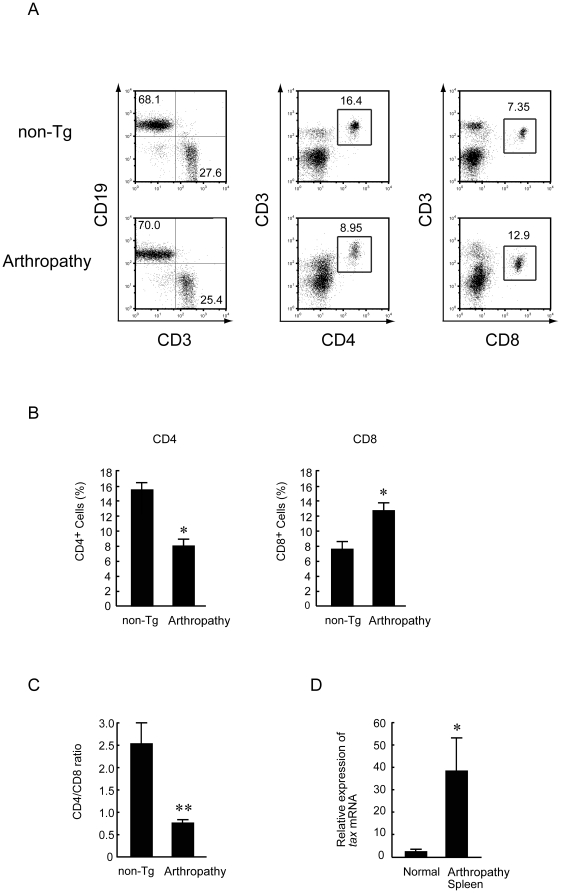
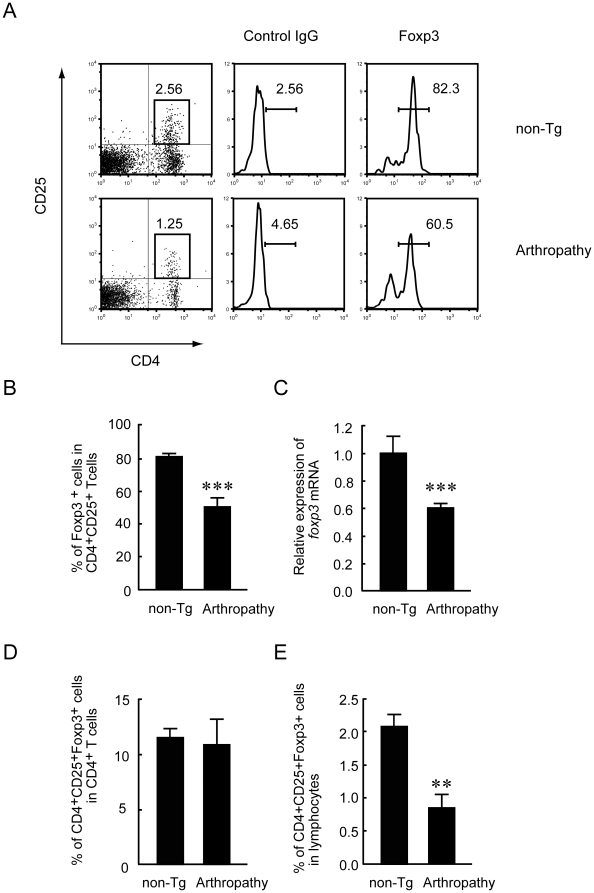
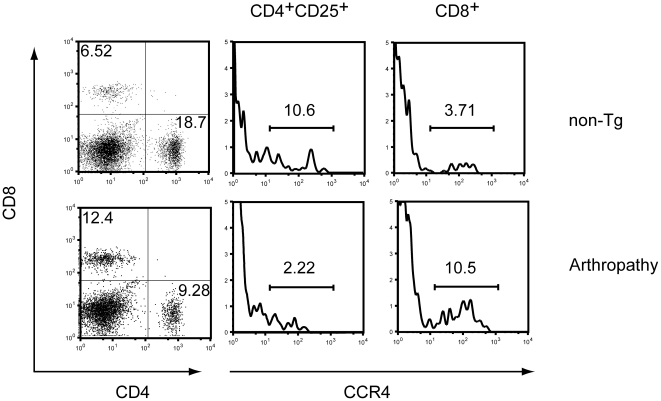
Principal findings: By 24 months of age, Tax transgenic mice developed severe arthropathy with a cumulative incidence of 22.8%. The pathological findings of arthropathy in Tax transgenic mice were similar to those seen in human rheumatoid arthritis or mouse models of rheumatoid arthritis, with synovial proliferation and a positive rheumatoid factor. Before the onset of spontaneous arthropathy, young and old Tax transgenic mice were not sensitive to collagen and did not develop arthritis after immunization with type II collagen. The arthropathic Tax transgenic mice showed a significantly decreased proportion of splenic CD4(+) T cells, whereas the proportion of splenic CD8(+) T cells was increased. Regulatory T cells (CD4(+)CD25(+)Foxp3(+)) were significantly decreased and CD8(+) T cells that expressed the chemokine receptor CCR4 (CD8(+)CCR4(+)) were significantly increased in arthropathic Tax transgenic mice. The expression of tax mRNA was strong in the spleen and joints of arthropathic mice, with a 40-fold increase compared with healthy transgenic mice.

Conclusions: Our findings reveal that Tax transgenic mice develop rheumatoid-like arthritis with proliferating synovial cells in the joints; however, the proportion of different splenic T-cell subsets in these mice was completely different from other commonly used animal models of rheumatoid arthritis. The crucial T-cell subsets in arthropathic Tax transgenic mice appear to resemble those in HAM/TSP patients rather than those in rheumatoid arthritis patients.


Conflict of interest statement

Competing Interests: The authors have declared that no competing interests exist.

Figures

Figure 1
Figure 1. Incidence of diseases in Tax transgenic mice.
Over a 2-year period, we studied 114 Tax transgenic (Tax-Tg) mice and 105 non-transgenic (non-Tg) mice. (A) Major phenotypes of disease were mature T-cell leukemia/lymphoma and arthropathy. The mice developed mature T-cell leukemia/lymphoma with an incidence of 28.1% and severe arthropathy with an incidence of 22.8%. (B) Expression of tax mRNA in lesions of arthropathic Tax transgenic mice relative to that in the spleens of healthy transgenic mice (n = 5 per group). Higher levels of tax mRNA were found in the joints of arthropathic Tax transgenic mice compared with leukemic Tax transgenic mice (n = 5 per group). (C) Arthropathy develops in Tax transgenic mice after a prolonged latency period of at least 9 months (left panel). The distribution of the cumulative incidence of arthropathy according to gender: male mice have an apparent higher tendency to develop arthropathy than female mice, although the difference was not statistically significant (right panel; P = 0.082, one-tailed Fisher's exact test).
Figure 2
Figure 2. Arthropathy in Tax transgenic mice.
(A) Hind legs of control non-transgenic mice (upper panel). Marked swelling of the ankles and digits of arthropathic Tax transgenic mice (lower panel). (B) Representative radiographic images of the hind legs of arthropathic Tax transgenic mice (Arthropathy) showed that the ankle joints were eroded, deformed, exhibited ankylosis, and clinically scored 2 (middle image) and 3 (right image). There was no lesion, however, in clinically healthy transgenic mice (Normal; left image). (C) Radiographic images of the whole body of a clinically healthy (left panel) mouse and an arthropathic (right panel) transgenic mouse. Bone destruction was observed mainly in the tarsal joint bilaterally (arrowheads). (D) Magnification of the radiographic images (4×) of the right hind legs in arthropathic (upper panel) and healthy (lower panel) transgenic mice. Bone destruction was restricted to the tarsal joint in arthropathic mice (arrow). (E) Bone destruction was observed in the tarsal joint bilaterally in all cases of arthropathic Tax transgenic mice. In some arthropathic Tax transgenic mice, bone destruction was also observed in the carpal joint bilaterally (16.6%, n = 24). (F) Serum calcium levels of arthropathic Tax transgenic mice (Arthropathy; n = 8) and age-matched healthy transgenic mice (Normal; n = 8) and non-transgenic control mice (non-Tg; n = 8). The serum calcium levels in arthropathic Tax transgenic mice were significantly increased compared with non-transgenic mice. ** P<0.01. (G) NF-κB activation in lesions of diseases in transgenic mice. Inflammatory cells from the joints of arthropathic Tax transgenic mice showed constitutive activation of NF-κB, which was significantly elevated compared with normal cells derived from healthy transgenic and non-transgenic control mice (n = 5 per group). * P<0.05.
Figure 3
Figure 3. Histological findings of arthropathy in Tax transgenic mice.
(A) An ankle joint showed papillary proliferation of synovial cells (arrowheads) and irregular surface of the joint (bar, 500 µm). (B) A high-power view showed lymphocyte infiltration and capillary proliferation at the area of synovial proliferation in panel A (bar, 100 µm). (C) Synovial proliferation and infiltrating inflammatory cells caused disappearance of cartilage of the articular surface and erosion of the bone similarly to pannus (bar, 100 µm). (D) A knee joint rarely showed severe destruction of the articular surface or fibrous adhesion of bones, indicated by black arrows, similarly to fibrous ankylosis (bar, 1000 µm).
Figure 4
Figure 4. Level of autoantibodies and cytokine production in Tax transgenic mice.
(A, B) Both anti-ssDNA and rheumatoid factor were elevated significantly in arthropathic Tax transgenic mice (Arthropathy; n = 7) compared with age-matched normal transgenic mice (Normal; n = 9) and non-transgenic mice (non-Tg; n = 9). (C) Cytokine mRNA expression in the joints of arthropathic and healthy Tax transgenic mice. Expression of mRNAs for the proinflammatory cytokines IL-1β, IL-6, and MIF was detected in arthropathic Tax transgenic mice but not in healthy transgenic mice. TNF-α expression, however, was not detected in either arthropathic or healthy transgenic mouse joint RNA. (D–F) Serum IL-6, TNF-α, and IL-17A concentrations in arthropathic (n = 15) and healthy (n = 11) transgenic mice, as well as that of age-matched non-transgenic control mice (n = 10). Serum IL-6 levels in arthropathic transgenic mice were significantly increased compared with non-transgenic mice. * P<0.05. There was no difference in levels of serum TNF-α or IL-17A between mouse groups.
Figure 5
Figure 5. Incidence and severity of arthropathy in Tax transgenic mice injected with type II collagen.
Young Tax transgenic mice (Young Tg; 2–3 months of age; ○), old Tax transgenic mice (Old Tg; 15–16 months of age; •) and non-transgenic mice (non-Tg; 2–3 months of age; Δ) were used. All mice were male (10 mice/group) and were immunized with type II collagen in complete Freund's adjuvant (day 0; 1st) and boosted with type II collagen in incomplete Freund's adjuvant at day 21 (2nd). One of the old Tax transgenic mice developed mild arthropathy before the first immunization. The incidence (panel A) and severity (panel B) of arthritis was determined. All three mouse groups were resistant to the development of type II collagen–induced arthritis.
Figure 6
Figure 6. Phenotype of T cells in arthropathic mice.
(A) A representative flow cytometric analysis of splenocytes stained with monoclonal antibodies to examine the expression of CD19 versus CD3, CD3 versus CD4, and CD3 versus CD8 in arthropathic Tax transgenic mice (Arthropathy; lower panel) and age-matched non-transgenic mice (non-Tg; upper panel). (B) Arthropathic Tax transgenic mice showed a lower proportion of CD4+ T cells and a higher proportion of CD8+ T cells than age-matched non-transgenic mice (n = 8 per group). * P<0.05. (C) The ratio of CD4+ T cells to CD8+ T cells (CD4+/CD8+) changed from 2.52 in the non-transgenic mice to 0.74 in arthropathic Tax transgenic mice (n = 8 per group) ** P<0.01. (D) The expression of tax mRNA in the spleen of arthropathic Tax transgenic mice was higher than that in healthy transgenic mice (n = 5 per group) * P<0.05.
Figure 7
Figure 7. Significantly decreased levels of CD4+CD25+ Treg cells in arthropathic Tax transgenic mice.
(A) Representative flow cytometric analysis of Foxp3 staining in gated CD4+CD25+ cells in arthropathic Tax transgenic mice (Arthropathy; lower panel) and age-matched non-transgenic mice (non-Tg; upper panel). (B) The majority of CD4+CD25+ T cells in non-transgenic mice expressed a high level of Foxp3 (81.2±1.4%), whereas half of CD4+CD25+ T cells in arthropathic Tax transgenic mice did not express Foxp3 (50.2±5.2%) (n = 6 per group), *** P<0.001. (C) The relative expression of splenic foxp3 mRNA was decreased in arthropathic Tax transgenic mice compared with non-transgenic mice (n = 6 per group), *** P<0.001). (D) The percentage of CD4+CD25+Foxp3+ Treg cells in CD4+ T cells did not differ between arthropathic Tax transgenic mice and non-transgenic mice (n = 6 per group). (E) Arthropathic Tax transgenic mice showed a significant decrease in the percentage of CD4+CD25+Foxp3+ Treg cells in splenic lymphocytes compared with non-transgenic mice (n = 6 per group), ** P<0.01.
Figure 8
Figure 8. Increased frequency of CD8+CCR4+ T cells in arthropathic Tax transgenic mice.
A representative flow cytometric analysis of CCR4-expressing T cells in gated CD4+CD25+ or CD8+ T cells in arthropathic Tax transgenic mice (Arthropathy; lower panel) and age-matched non-transgenic mice (non-Tg; upper panel). The proportion of CCR4-expressing CD4+CD25+ cells in arthropathic Tax transgenic mice (Arthropathy, lower middle panel) was lower than that of age-matched non-transgenic mice (non-Tg; upper middle panel), whereas the percentage of CD8+CCR4+ T cells was increased in arthropathic Tax transgenic mice compared to non-transgenic mice (right panels).

Similar articles

Cited by

References

    1. Watanabe T. HTLV-1-associated diseases. Int J Hematol. 1997;66:257–278. - PubMed
    1. Verdonck K, Gonzalez E, Van Dooren S, Vandamme AM, Vanham G, et al. Human T-lymphotropic virus 1: recent knowledge about an ancient infection. Lancet Infect Dis. 2007;7:266–281. - PubMed
    1. Grassmann R, Aboud M, Jeang KT. Molecular mechanisms of cellular transformation by HTLV-1 Tax. Oncogene. 2005;24:5976–5985. - PubMed
    1. Matsuoka M, Jeang KT. Human T-cell leukaemia virus type 1 (HTLV-1) infectivity and cellular transformation. Nat Rev Cancer. 2007;7:270–280. - PubMed
    1. Lairmore MD, Silverman L, Ratner L. Animal models for human T-lymphotropic virus type 1 (HTLV-1) infection and transformation. Oncogene. 2005;24:6005–6015. - PMC - PubMed

Publication types

MeSH terms