. 2011 Mar 31;6(3):e18425.
doi: 10.1371/journal.pone.0018425.

The cell cycle regulated transcriptome of Trypanosoma brucei

Affiliations

The cell cycle regulated transcriptome of Trypanosoma brucei

Stuart K Archer et al. PLoS One. .

Abstract

Progression of the eukaryotic cell cycle requires the regulation of hundreds of genes to ensure that they are expressed at the required times. Integral to cell cycle progression in yeast and animal cells are temporally controlled, progressive waves of transcription mediated by cell cycle-regulated transcription factors. However, in the kinetoplastids, a group of early-branching eukaryotes including many important pathogens, transcriptional regulation is almost completely absent, raising questions about the extent of cell-cycle regulation in these organisms and the mechanisms whereby regulation is achieved. Here, we analyse gene expression over the Trypanosoma brucei cell cycle, measuring changes in mRNA abundance on a transcriptome-wide scale. We developed a "double-cut" elutriation procedure to select unperturbed, highly synchronous cell populations from log-phase cultures, and compared this to synchronization by starvation. Transcriptome profiling over the cell cycle revealed the regulation of at least 430 genes. While only a minority were homologous to known cell cycle regulated transcripts in yeast or human, their functions correlated with the cellular processes occurring at the time of peak expression. We searched for potential target sites of RNA-binding proteins in these transcripts, which might earmark them for selective degradation or stabilization. Over-represented sequence motifs were found in several co-regulated transcript groups and were conserved in other kinetoplastids. Furthermore, we found evidence for cell-cycle regulation of a flagellar protein regulon with a highly conserved sequence motif, bearing similarity to consensus PUF-protein binding motifs. RNA sequence motifs that are functional in cell-cycle regulation were more widespread than previously expected and conserved within kinetoplastids. These findings highlight the central importance of post-transcriptional regulation in the proliferation of parasitic kinetoplastids.


Conflict of interest statement

Competing Interests: The authors have declared that no competing interests exist.

Figures

Figure 1
Figure 1. Synchronization of procyclic cells by starvation.
Four biological replicates were performed in which cells were released from starvation at time t = 0 and samples collected for flow cytometry and RNA isolation at t = 5, 7 and 9 hours post-release. A: Flow cytometry profiles of synchronized procyclic cells. Propidium iodide fluorescence (indicating DNA content) is measured on the x-axes and cell count is plotted on the y-axes. B: Northern hybridization of a known cell-cycle regulated transcript (LIGKA) against RNA from synchronized cells.
Figure 2
Figure 2. Expression profiling by DCE and RNA-seq.
A: Flow cytometry profiles of procyclic cells throughout the DCE selection procedure. Propidium iodide fluorescence (indicating DNA content) is measured on the x-axes and cell count on the y-axes. B: Regulation amplitude (the difference between the maximum and minimum expression value throughout the cell cycle) was calculated for each gene. After ranking genes according to minimum read count, the median (black) and upper and lower quartile (blue) amplitude values across a moving window of 100 genes was calculated. Genes with fewer than ∼300 reads in any time point (red line) gave amplitudes that were most likely to be a function of sequencing effort and were therefore excluded from further analysis. C: Comparison of gene regulatory amplitude between the starve-synch/microarray-analyzed cells (time points 5, 7 and 9 hrs) and DCE-synch/RNA seq-analyzed cells (time points 3, 5.5 and 7.25 hrs). Genes passing quality control in the RNA-seq experiment and with less than 1.23-fold regulation (0.3 log2 units - red lines) in both experiments (red box) were selected as a non-regulated control group for subsequent UTR sequence analyses (motif searching). D: Comparison of read counts per transcript for each time-point with the average read counts from the other 3 time points. Red boxes contain transcripts with >300 reads.
Figure 3
Figure 3. Comparison of genes ranked by regulation amplitudes, between cells synchronized by DCE-selection (RNA-seq) or starvation (microarrays).
A: Genes were plotted according to their regulation amplitude rank within each dataset, such that the most highly regulated gene was ranked as #1 and so on. Only genes peaking at equivalent times between the two experiments were plotted in the right three panels; all genes were plotted in the left panel. Genes ranking in the least-regulated one-third of the starve-synch dataset (shaded area) were assumed to be representative of genes whose regulation in the DCE experiment was not corroborated by the starve-synch experiment. Red line: 20% non-corroboration threshold derived in B. B: A threshold gene-rank in the DCE/RNA-seq dataset (horizontal axis) was varied incrementally and the number of non-corroborated genes inside this cut-off rank was estimated as three times the number of the included genes that were also in the lowest-ranked one-third of the MA data (A; shaded area). For each cut-off rank, the percentage of included non-corroborated genes was estimated (blue circles) with a moving average (orange line). The red dashed line (A and B) indicates the point at which 20% of discovered genes (i.e. to the left of the line) were non-corroborated; the number of genes included using this cutoff rank is indicated. This could be an over-estimation of the false-discovery rate, as genuinely regulated genes might not be detectably regulated in the starve-synch experiment due to differences in the experimental setup.
Figure 4
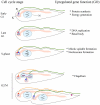
Figure 4. Relationship between formation of cellular components and cell-cycle regulated gene expression.
Right: summary of functions of upregulated genes as suggested by GO analysis. Left: Representation of procyclic T. brucei cells progressing through the cell cycle. K: the kinetoplast (organelle containing the mtDNA, which consists of many circular DNA molecules). N: Nucleus. B: Basal body (blue rectangle) and pro-basal body (red rectangle). In light pink is the mitochondrion; in green is the old flagellum, which emerges from the posterior end of the cell (left) but is tethered to the dorsal side of the cell along its length. In late G1 phase the probasal body (small red rectangle) matures into a new basal body which will localize the base of the new flagellum, and the kinetoplast is already in S-phase. In S-phase, the new flagellum (orange) begins to elongate, anchored to the old flagellum by a mobile flagellar connector structure (orange circle) , while the kinetoplasts and basal bodies separate. After DNA replication an intranuclear mitotic spindle forms (pink line) and cells enter mitosis. Before cytokinesis, the Chromosomal Passenger Complex relocates from the spindle to the cell anterior (pink circle, bottom panel) where it moves with the cytokinetic furrow from anterior to posterior (dotted line) .
Figure 5
Figure 5. Vectorial representation of regulation of selected functional groups of transcripts in the cell cycle, from DCE/RNA-seq data (left panels) or starve-synch/microarray data (right panels).
Each time-point in the cell cycle that was analyzed was arranged as a vector pointing outwards from the origin. Gene expression values were plotted by vector addition; tick marks on axes are one log2 unit. Reference profiles from 1000 randomly selected genes are plotted in grey; genes in specific functional groups are plotted as coloured circles. A: Red: Transcripts annotated with “DNA” in “product description” or in gene ontology fields of the TriTryp database (relevance score >40). Orange: Histone-encoding transcripts. B: Red: Transcripts encoding flagellar proteins . Orange: Transcripts encoding Snl2-dependent paraflagellar rod proteins . C: Putative mediators of mitosis and cytokinesis, and RBPs. Red: Transcripts encoding Aurora kinases and chromosomal passenger complex proteins. Orange: Polo-like kinase. Blue: Selected RBPs. (×) PUF9, (+) RBP45 homologue, (o) DRDB17.
Figure 6
Figure 6. Identification of over-represented sequence motifs among selected clusters of co-regulated transcripts.
Cluster expression profiles from DCE/RNA-seq data are plotted on the left, with the log2 expression values on the y axis and time on the x axis. The top-ranking over-represented sequence motifs from UTR sequences in four kinetoplastid species, as found using Trawler, are presented on the right with the z-score below. (*) indicates motifs supported by MEME analysis of Cluster #1 (see Table S5). Top: a dendrogram showing the phylogenetic relationship between species.

References

    1. Simon I, Barnett J, Hannett N, Harbison CT, Rinaldi NJ, et al. Serial regulation of transcriptional regulators in the yeast cell cycle. Cell. 2001;106:697–708. - PubMed
    1. Vaughan PS, van der Meijden CM, Aziz F, Harada H, Taniguchi T, et al. Cell cycle regulation of histone H4 gene transcription requires the oncogenic factor IRF-2. J Biol Chem. 1998;273:194–199. - PubMed
    1. Harris ME, Bohni R, Schneiderman MH, Ramamurthy L, Schumperli D, et al. Regulation of histone mRNA in the unperturbed cell cycle: evidence suggesting control at two posttranscriptional steps. Mol Cell Biol. 1991;11:2416–2424. - PMC - PubMed
    1. Van Den Abbeele J, Claes Y, van Bockstaele D, Le Ray D, Coosemans M. Trypanosoma brucei spp. development in the tsetse fly: characterization of the post-mesocyclic stages in the foregut and proboscis. Parasitology. 1999;118 (Pt 5):469–478. - PubMed
    1. Clayton CE. Life without transcriptional control? From fly to man and back again. Embo J. 2002;21:1881–1888. - PMC - PubMed

Publication types

MeSH terms

Substances