. 2011 Mar;7(3):e1001356.
doi: 10.1371/journal.pgen.1001356. Epub 2011 Mar 31.

Widespread hypomethylation occurs early and synergizes with gene amplification during esophageal carcinogenesis

Affiliations

Widespread hypomethylation occurs early and synergizes with gene amplification during esophageal carcinogenesis

Hector Alvarez et al. PLoS Genet. 2011 Mar.

Erratum in

  • PLoS Genet. 2011 May;7(5). doi: 10.1371/annotation/8dcded85-a924-40f4-a7ea-56961b87447f. Meltzer, Stephen [corrected to Meltzer, Stephen J]

Abstract

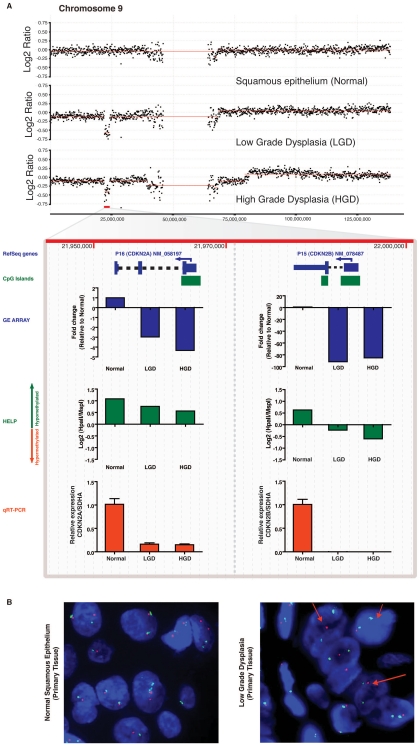
Although a combination of genomic and epigenetic alterations are implicated in the multistep transformation of normal squamous esophageal epithelium to Barrett esophagus, dysplasia, and adenocarcinoma, the combinatorial effect of these changes is unknown. By integrating genome-wide DNA methylation, copy number, and transcriptomic datasets obtained from endoscopic biopsies of neoplastic progression within the same individual, we are uniquely able to define the molecular events associated progression of Barrett esophagus. We find that the previously reported global hypomethylation phenomenon in cancer has its origins at the earliest stages of epithelial carcinogenesis. Promoter hypomethylation synergizes with gene amplification and leads to significant upregulation of a chr4q21 chemokine cluster and other transcripts during Barrett neoplasia. In contrast, gene-specific hypermethylation is observed at a restricted number of loci and, in combination with hemi-allelic deletions, leads to downregulatation of selected transcripts during multistep progression. We also observe that epigenetic regulation during epithelial carcinogenesis is not restricted to traditionally defined "CpG islands," but may also occur through a mechanism of differential methylation outside of these regions. Finally, validation of novel upregulated targets (CXCL1 and 3, GATA6, and DMBT1) in a larger independent panel of samples confirms the utility of integrative analysis in cancer biomarker discovery.


Conflict of interest statement

The authors have declared that no competing interests exist.

Figures

Figure 1
Figure 1. Global hypomethylation is seen early during esophageal carcinogenesis.
Multiple endoscopic biopsies collected at the same time from patients with clinical history of Barrett's esophagus, were classified as normal squamous epithelium, Barrett's metaplasia, low grade dysplasia (LGD), high grade dysplasia (HGD) and adenocracinoma based on histology. (Panel A). Frozen tissue samples were homogenized, used for DNA and RNA isolation and were subjected to global expression profiling, DNA methylation profiling and DNA copy number analysis. Unsupervised hierarchical clustering based on gene expression profiling shows clustering of distinct histologic tissues with glandular tissue from stomach cardia being more similar to metaplastic and dysplastic tissues (Panel B). Clustering based on methylation shows dissimilarity between normal (esophageal and stomach) and abnormal tissues (Panel C). Volcano plots demonstrating significance and magnitude of change in mean gene expression (Panel D) and DNA methylation (Panel E) are shown. Each plot represents either 36,847 genes from the microarray experiment (D) or 25,626 HpaII-amplifiable fragments (HAF) from the HELP assay (E). The log2 ratio of difference of means is shown on the x-axis and the negative log of the p-value (based on paired T-Test) is shown on the y-axis. Genes that are significantly downregulated (panel D) or hypermethylated (panel E) are shown in green and red dots indicate genes that are either upregulated (panel D) or hypomethylated (panel E). Global methylation is shown by density plots of log2 of HpaII/MspI ratios and shows bimodal distribution in normal epithelial tissues with both hypo and hypermethylated loci. The red line denotes the median HpaII/MspI ratio for random probes. A shift towards hypomethylation is observed during transformation of normal to low grade dysplasia in a representative series of samples (Panel F). Quantitative methylation for matched pairs of normal and Barrett's dysplasia as done by the LUMA assay. X axis shows mean percent hypomethylation of 3 independent paired samples. (Panel G).
Figure 2
Figure 2. DMBT1 upregulation by non-CpG island methylation changes.
Differentially methylated loci between normal esophageal epithelium and Barretts/LGD were mapped to genomic locations of CpG islands. A large percentage of these loci were not within CpG islands. Paired T Test was used to compare to distribution of loci present on the HELP array (A). The DMBT1 gene is not amplified (panel B) and lacks a CpG island in its promoter. DMBT1 was seen to be significantly upregulated and hypomethylated during integrative analysis and marked upregulation was validated by qRT-PCR (red bar). Significant hypomethylation was seen by the HELP assay (green bar) and validated by quantitative MassArray (B). Immunohistochemical evaluation of the protein levels of the DMBT1 gene on primary tissues shows a frequent and significant protein upregulation during early stage dysplasia (panel C,D).
Figure 3
Figure 3. Global integrative analysis of transcriptomic, epigenomic, and DNA copy number data.
Probes from all three arrays were linked to genes on the basis of genomic coordinates isolated from NCBI build35. Pairwise analysis was performed between main histologic groups of normal squamous vs LOW (B) and LOW vs HIGH (C). The x axis represents fold-change differences (log2) in gene expression, the y axis represents fold-change differences (log2) in methylation and the z axis represents the significance of these changes (–log10 p-value) for both platforms. Upregulated genes (>2.5 fold change in GE with a p-value<0.05) are shown in green and downregulated genes are shown in red. Darker shading of these colors is used to represent genes that are significantly differentially methylated. Hypermethylated genes are at the top of the graph and hypomethylated genes on the bottom. Finally, copy number changes are defined by “volume”. Genes with copy number changes (amplified or deleted) are depicted by larger sized circles. This plot allows us to visualize differentially regulated genes and the mechanisms of their dysregulation.
Figure 4
Figure 4. Differential inactivation of the CDKN2A/CDKN2B locus by combination of genomic and epigenetic mechanisms.
In an index patient with serial progression biopsies, there is a hemizygous deletion of the CDKN2A/CDKN2B gene locus at 9p21, beginning at the stage of LGD, and persisting into the corresponding HGD sample (Panel A), which is accompanied by expected downregulation of both transcripts in expression microarray data. Although independent qRT-PCR for CDKN2A and CDKN2B transcripts (red bars) validates the expression array data (blue bars), the magnitude of downregulation of CDKN2B is more pronounced than CDKN2A (∼100-fold versus ∼5-fold on microarray, and complete absence of CDKNA2B transcripts on qRT-PCR versus downregulated but detectable CDKN2A transcripts). MIGHT analysis confirms that this discrepancy between closely spaced hemizygously deleted loci correlates with increased promoter methylation of the residual CDKNA2B allele, as demonstrated by the HELP assay (green bars); such progressive hypomethylation is not observed on the residual CDKN2A allele and likely is responsible for the reduced but demonstrable transcripts. Uniallelic deletion of the CDKN2A/CDKN2B locus is validated by FISH (Panel B) on primary tissue as shown by loss on the LSI p16 SpectrumOrange probe (red arrows).
Figure 5
Figure 5. Aberrant expression of a 4q21 chemokine cluster by gene amplification and promoter hypomethylation during esophageal carcinogenesis.
In an index patient with serial progression biopsies, amplification of chromosome 4q21, containing a cluster of genes transcribing chemokine ligands, is seen beginning at LGD, and persisting into HGD (Panel A). Expression and promoter methylation data for three representative genes in this amplicon (CXCL1, CXCL3, and IL8) are shown below the copy number window. All three transcripts are upregulated in the LGD and HGD samples by microarray data (blue bars), which is validated using independent qRT-PCR assays (red bars). Nonetheless, there is strikingly higher upregulation of CXCL1 (>200-fold on qRT-PCR compared to matched normal) and CXCL3 (500–700 fold on qRT-PCR compared to normal), versus the 10–30 fold upregulation in IL8 mRNA. Integrative analysis on the MIGHT platform confirms that this is likely arises due to progressive hypomethylation of the CXCL1 and CXCL3 promoters (as gauged by HELP assay, green bars), which is not seen at the IL8 promoter. The hypomethylation of CXCL1 observed in the dysplastic samples by the HELP assay is validated by Mass Array at the bottom. The 4q21 chemokine cluster amplification is also confirmed by FISH (Panel B) on the corresponding archival HGD sample from the same individual used in the integrative analysis. The RP11-94K4 SpectrumOrange probe representing the 4q21.1 - 4q21.2 amplicon (red arrows) was used. Moreover, the upregulation of IL8, CXCL1, and CXCL3 transcripts is also confirmed in an independent panel of endoscopic mucosal biopsy samples, including LGD (N = 5), HGD (N = 5), and adenocarcinoma (N = 3) (Panel C). Notably, the significantly greater upregulation of CXCL1 and CXCL3 transcripts observed in the index patient persists in this independent cohort of cases. Finally, chemokine detection using a multiplex chemiluminiscent assay was performed on five serum samples from patients with esophageal adenocarcinoma (designated “Cancer”) and compared to samples from controls with GERD symptoms and normal esophageal histology (designated “Normal”) (Panel D). Serum levels of only two chemokines, IL-8 and CXCL-10, both encoded by the 4q21 cluster, are significantly higher in cancer patients when compared to normals, supporting the evidence that members encoded by this amplicon are expressed at higher levels when compared to chemokines that are not part of the amplicon, such as CCL2, CCL11 and CCL13. Unfortunately, CXCL1 and CXCL3 were not included in this pre-formed multiplex assay.
Figure 6
Figure 6. GATA6 is amplified and functions as an oncogene in esophageal adenocarcinoma.
In an index patient with serial progression biopsies, aCGH shows a progressive copy number gain on the region 18q11.1-q11.2 from normal to dysplasia to cancer. (Panel A). Integrative approach demonstrates GATA6 and LAMA3 as two genes contained on this cluster (from 17–23,000,000 bp windows) with the marked upregulation during transformation of normal to dysplasia as well as from dysplasia to cancer. qRT-PCR (red bar) validates the findings on the GE array (blue bar) and also correlates with the increasing copy number doses seen in the aCGH. No relevant change is detected by the HELP assay (green bar), showing persistence of unmethylated HpaII sites on the promoter region. GATA6 amplification was corroborated by FISH in the primary adenocarcinoma tissue from this patient (panel B), RP11-18K7 spectrumOrange represent the 18q11.1-q11.2 region containing the GATA6 gene (red arrows). qRT-PCR on independent frozen primary tissues demonstrates high detectable mRNA levels in dysplasia and cancer (Mean +/− SEM). Immunohistochemical analysis on large number of primary tissues demonstrates elevated protein levels arising as early as in the LGD group. Percentage frequency of combined results from TMA and EMR are shown (Panel D) and examples of high IHC scores are shown (Panel F-I). To test the functional role of GATA6 upregulation, its expression was characterized in Barrett's associated adenocarcinoma cell lines (Panel J). Stable knock down of GATA6 from five shRNAs were screened by qRT-PCR in OE33 cell line (Panel K). shRNA-3 was selected for further experiments. Although there is no effect on cell viability (panel L), GATA6 loss significantly decreases cell migration (Panel M), Invasion (Panel N) and anchorage independent growth (panel O-P).

References

    1. Zhang HY, Spechler SJ, Souza RF. Esophageal adenocarcinoma arising in Barrett esophagus. Cancer Lett. 2009;275:170–177. - PMC - PubMed
    1. Eloubeidi MA, Mason AC, Desmond RA, El-Serag HB. Temporal trends (1973-1997) in survival of patients with esophageal adenocarcinoma in the United States: a glimmer of hope? Am J Gastroenterol. 2003;98:1627–1633. - PubMed
    1. Montgomery E, Bronner MP, Goldblum JR, Greenson JK, Haber MM, et al. Reproducibility of the diagnosis of dysplasia in Barrett esophagus: a reaffirmation. Hum Pathol. 2001;32:368–378. - PubMed
    1. Montgomery E, Goldblum JR, Greenson JK, Haber MM, Lamps LW, et al. Dysplasia as a predictive marker for invasive carcinoma in Barrett esophagus: a follow-up study based on 138 cases from a diagnostic variability study. Hum Pathol. 2001;32:379–388. - PubMed
    1. Spechler SJ. Clinical practice. Barrett's Esophagus. N Engl J Med. 2002;346:836–842. - PubMed

Publication types

MeSH terms