

Weight trimming and propensity score weighting
- PMID: 21483818
- PMCID: PMC3069059
- DOI: 10.1371/journal.pone.0018174
Weight trimming and propensity score weighting
Abstract
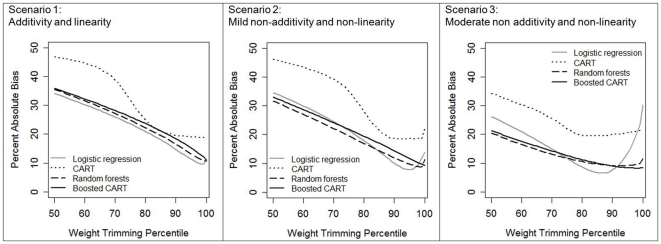
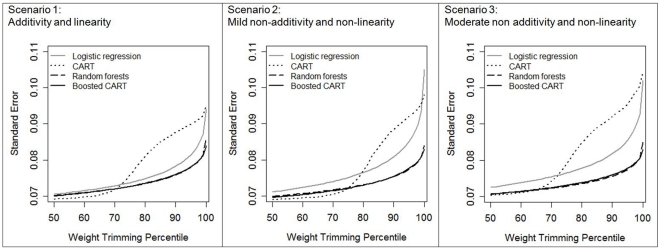
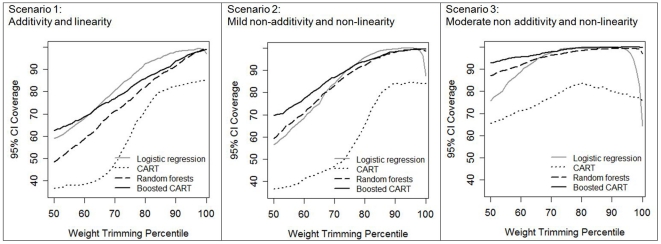
Propensity score weighting is sensitive to model misspecification and outlying weights that can unduly influence results. The authors investigated whether trimming large weights downward can improve the performance of propensity score weighting and whether the benefits of trimming differ by propensity score estimation method. In a simulation study, the authors examined the performance of weight trimming following logistic regression, classification and regression trees (CART), boosted CART, and random forests to estimate propensity score weights. Results indicate that although misspecified logistic regression propensity score models yield increased bias and standard errors, weight trimming following logistic regression can improve the accuracy and precision of final parameter estimates. In contrast, weight trimming did not improve the performance of boosted CART and random forests. The performance of boosted CART and random forests without weight trimming was similar to the best performance obtainable by weight trimmed logistic regression estimated propensity scores. While trimming may be used to optimize propensity score weights estimated using logistic regression, the optimal level of trimming is difficult to determine. These results indicate that although trimming can improve inferences in some settings, in order to consistently improve the performance of propensity score weighting, analysts should focus on the procedures leading to the generation of weights (i.e., proper specification of the propensity score model) rather than relying on ad-hoc methods such as weight trimming.
Conflict of interest statement
Figures
Similar articles
-
Improving propensity score weighting using machine learning.Stat Med. 2010 Feb 10;29(3):337-46. doi: 10.1002/sim.3782. Stat Med. 2010. PMID: 19960510 Free PMC article.
-
Propensity Score Weighting and Trimming Strategies for Reducing Variance and Bias of Treatment Effect Estimates: A Simulation Study.Am J Epidemiol. 2021 Aug 1;190(8):1659-1670. doi: 10.1093/aje/kwab041. Am J Epidemiol. 2021. PMID: 33615349 Free PMC article.
-
Propensity score weighting under limited overlap and model misspecification.Stat Methods Med Res. 2020 Dec;29(12):3721-3756. doi: 10.1177/0962280220940334. Epub 2020 Jul 21. Stat Methods Med Res. 2020. PMID: 32693715
-
Causal Inference with Multilevel Data: A Comparison of Different Propensity Score Weighting Approaches.Multivariate Behav Res. 2022 Nov-Dec;57(6):916-939. doi: 10.1080/00273171.2021.1925521. Epub 2021 Jun 15. Multivariate Behav Res. 2022. PMID: 34128730 Review.
-
Propensity score analysis with missing data.Psychol Methods. 2016 Sep;21(3):427-45. doi: 10.1037/met0000076. Epub 2016 Mar 10. Psychol Methods. 2016. PMID: 26962757 Review.
Cited by
-
Evaluating the impact of long-term exposure to fine particulate matter on mortality among the elderly.Sci Adv. 2020 Jul 17;6(29):eaba5692. doi: 10.1126/sciadv.aba5692. eCollection 2020 Jul. Sci Adv. 2020. PMID: 32832626 Free PMC article.
-
Weighted nearest neighbours-based control group selection method for observational studies.PLoS One. 2020 Jul 23;15(7):e0236531. doi: 10.1371/journal.pone.0236531. eCollection 2020. PLoS One. 2020. PMID: 32701991 Free PMC article.
-
Statistical methods for assessing drug interactions using observational data.J Appl Stat. 2022 Sep 20;51(2):298-323. doi: 10.1080/02664763.2022.2123460. eCollection 2024. J Appl Stat. 2022. PMID: 38283050 Free PMC article.
-
Instrumental variable estimation of truncated local average treatment effects.PLoS One. 2021 Apr 5;16(4):e0249642. doi: 10.1371/journal.pone.0249642. eCollection 2021. PLoS One. 2021. PMID: 33819276 Free PMC article.
-
Investigating Risk Adjustment Methods for Health Care Provider Profiling When Observations are Scarce or Events Rare.Health Serv Insights. 2018 Jul 5;11:1178632918785133. doi: 10.1177/1178632918785133. eCollection 2018. Health Serv Insights. 2018. PMID: 30083056 Free PMC article.
References
-
- Rosenbaum PR, Rubin DB. The central role of the propensity score in observational studies for causal effects. Biometrika. 1983;70:41–55.
-
- Austin PC. The relative ability of different propensity score methods to balance measured covariates between treated and untreated subjects in observational studies. Med Decis Making. 2009;29:661–677. - PubMed
-
- Harder VS, Morral AR, Arkes J. Marijuana use and depression among adults: Testing for causal associations. Addiction. 2006;101:1463–1472. - PubMed
Publication types
MeSH terms
Grants and funding
LinkOut - more resources
Full Text Sources
Other Literature Sources
Molecular Biology Databases
