. 2011 Mar 31;6(3):e18264.
doi: 10.1371/journal.pone.0018264.

Phosphorylation of AMPA receptors is required for sensory deprivation-induced homeostatic synaptic plasticity

Affiliations

Phosphorylation of AMPA receptors is required for sensory deprivation-induced homeostatic synaptic plasticity

Anubhuti Goel et al. PLoS One. .

Abstract

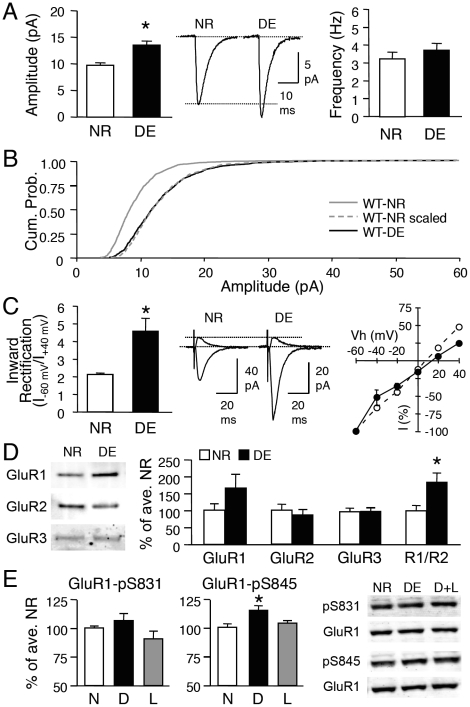
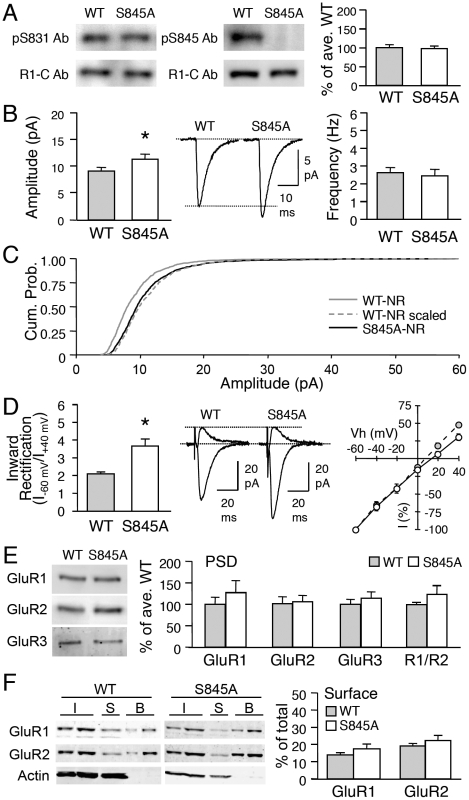
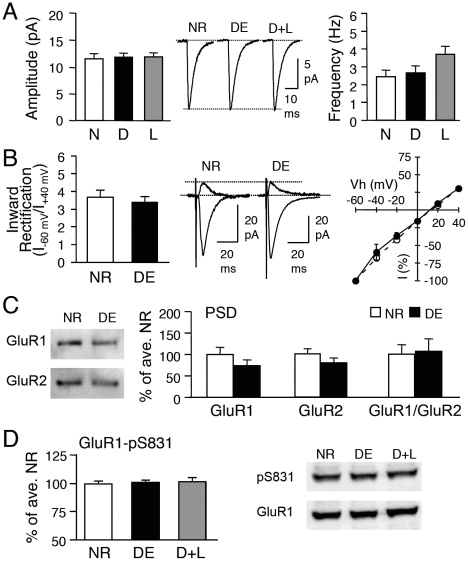
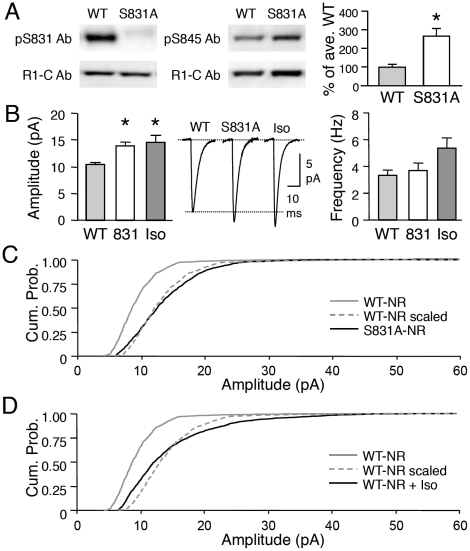
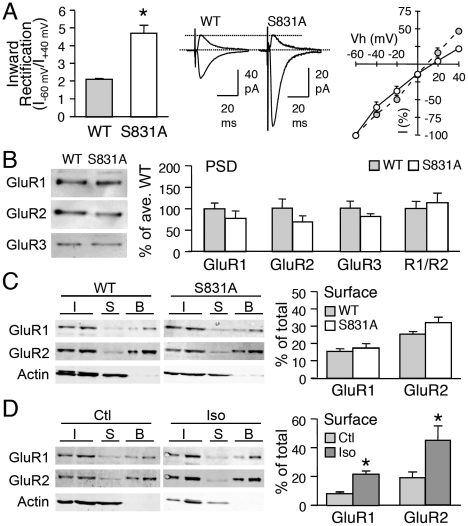
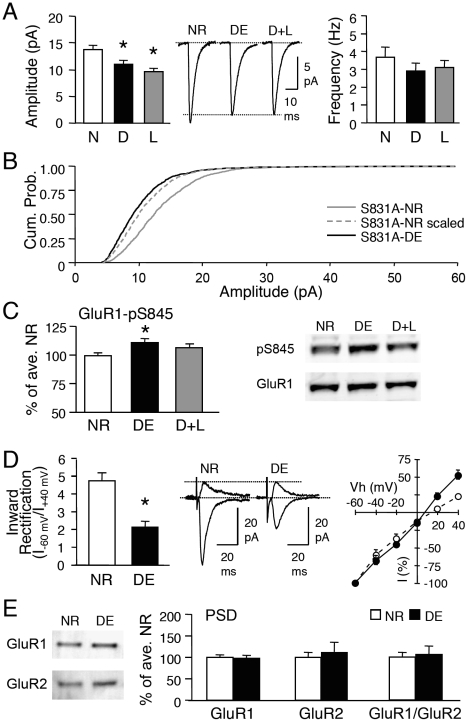
Sensory experience, and the lack thereof, can alter the function of excitatory synapses in the primary sensory cortices. Recent evidence suggests that changes in sensory experience can regulate the synaptic level of Ca(2+)-permeable AMPA receptors (CP-AMPARs). However, the molecular mechanisms underlying such a process have not been determined. We found that binocular visual deprivation, which is a well-established in vivo model to produce multiplicative synaptic scaling in visual cortex of juvenile rodents, is accompanied by an increase in the phosphorylation of AMPAR GluR1 (or GluA1) subunit at the serine 845 (S845) site and the appearance of CP-AMPARs at synapses. To address the role of GluR1-S845 in visual deprivation-induced homeostatic synaptic plasticity, we used mice lacking key phosphorylation sites on the GluR1 subunit. We found that mice specifically lacking the GluR1-S845 site (GluR1-S845A mutants), which is a substrate of cAMP-dependent kinase (PKA), show abnormal basal excitatory synaptic transmission and lack visual deprivation-induced homeostatic synaptic plasticity. We also found evidence that increasing GluR1-S845 phosphorylation alone is not sufficient to produce normal multiplicative synaptic scaling. Our study provides concrete evidence that a GluR1 dependent mechanism, especially S845 phosphorylation, is a necessary pre-requisite step for in vivo homeostatic synaptic plasticity.


Conflict of interest statement

Competing Interests: The authors have declared that no competing interests exist.

Figures

Figure 1
Figure 1. Visual deprivation induces homeostatic changes in excitatory synaptic transmission of layer 2/3 neurons in WT mice.
(A) Left: Two days of DE (P21-P23) significantly increased the average mEPSC amplitude (*: t-test, p<0.001). Middle: Average mEPSC traces from WT-NR and WT-DE mice. Right: No difference in the average mEPSC frequency. (B) Cumulative probability of mEPSC amplitude of WT-DE (black solid line) is shifted to larger values (rightward shift) compared to WT-NR (gray solid line). When mEPSC amplitudes of WT-NR are multiplied by a factor (1.4) to match the average mEPSC amplitude of WT-DE, the cumulative probability curve (WT-NR scaled, gray dotted line) superimposes completely on the WT-DE curve (adjusted by removing the noise cut-off). This suggests that DE multiplicatively scales up mEPSC amplitudes. (C) Left: DE significantly increased the average inward rectification index (I–60 mV/I+40 mV) of evoked AMPAR-EPSC (*: t-test, p<0.02). Middle: Superimposed representative AMPAR-EPSC traces measured at -60 mV and +40 mV for NR and DE conditions. Right: I-V plot of evoked AMPAR-EPSC. Note that the I-V curve is linear in NR mice (open circles) and inward rectifying (black circles) in DE mice. (D) DE increased the GluR1/GluR2 (R1/R2) ratio in isolated PSD fractions from the visual cortex. Comparison of GluR1 (left), GluR2 (2nd from left), and GluR3 (3rd from left) levels and the R1/R2 ratio (rightmost) at the PSD of NR and DE. Left panel: Example immunoblots probed with antibody against GluR1 C-terminal, GluR2 N-terminal, and GluR3. *: t-test, p<0.02. (E) Left: No significant change in GluR1-S831 phosphorylation across NR (N), DE (D) and D+L (L) groups. Middle: DE (D) significantly increased GluR1-S845 phosphorylation compared to NR (N) and D+L (L). Right: Sample immunoblots probed with phospho-specific antibody to GluR1-S831 (pS831) and GluR1-S845 (pS845). Each blot was simultaneously probed with a GluR1 C-terminal antibody (GluR1). *: Significantly different from NR and D+L at p<0.001 with Fisher's PLSD posthoc test following a one-factor ANOVA.
Figure 2
Figure 2. GluR1-S845A mutants have larger mEPSCs and have functional CP-AMPARs under basal conditions.
(A) Immunoblot analysis of visual cortex samples from normal-reared WT and S845A mutants. Left: Sample immunoblot probed simultaneously with phospho-antibody for GluR1-S831 (pS831 Ab) and GluR1 C-terminal antibody (R1-C Ab). Middle: Sample immunoblot simultaneously probed with phospho-antibody for GluR1-S845 (pS845 Ab) and R1-C Ab. Note the absence of pS845 Ab signal in S845A sample. Right: Quantification of relative phosphorylation at GluR1-S831 in WT and S845A mutants. (B) Left: Significantly larger average basal mEPSC amplitude in GluR1-S845A mutants (*: t-test, p<0.05). Middle: Average mEPSC traces from WT and S845A. Right: No change in average mEPSC frequency. (C) GluR1-S845A mutants display larger mEPSC amplitude values under basal conditions (normal-reared) when compared to WTs. This is shown as a rightward shift in the cumulative probability graph of S845A-NR (black solid line) when compared to that of WT-NR (gray solid line). The amplitude of individual mEPSCs recorded from WT-NR was multiplied by a factor (1.2) to allow the average mEPSC amplitude of WT NR to match that of S845A-NR (WT-NR scaled, gray dotted line). The cumulative probability curve of WT-NR scaled (gray dotted line) was statistically significantly different from the S845A-NR curve (black solid line) (p<0.05, Kolmogrov-Smirnov test) suggesting that S845A mutation does not multiplicatively scale up mEPSCs compared to WT. (D) Left: Significantly larger inward rectification index of evoked AMPAR-EPSC from S845A mutants (*: t-test, p<0.01). Middle: Superimposed inward (Vh = –60 mV) and outward (Vh = +40 mV) currents through AMPARs from NR WT and S845A. Right: I-V plot of evoked AMPAR-EPSC. Note: I-V curve of S845A mice is inward rectifying (open circles) compared to WTs (gray circles). (E) No difference in GluR1 (left), GluR2 (2nd from left), GluR3 (3rd from left), and GluR1/GluR2 (R1/R2) ratio (right) in PSDs of WT and GluR1-S845A. Left panel: Example blots. (F) Left: Example immunoblots of steady-state biotinylation on isolated layer 2/3 visual cortex slices from wildtype (WT) and S845A mutant (S845A). Different amount of total sample (I, input: 2.5% and 5% of total input each lane), intracellular fraction (S, supernatant), and surface biotinylated fraction (B: 10% and 20% of total biotinylated sample each lane) were loaded to the gel, and probed for GluR1, GluR2, and actin. Right: Quantification of surface GluR1 and GluR2 expressed as a percentage of total GluR1 and GluR2 from each blot. No significant difference in GluR1 or GluR2 was observed between wildtypes and S845A mutants.
Figure 3
Figure 3. Visual experience-induced homeostatic synaptic changes are absent in GluR1-S845A mutants.
(A) No significant change in average mEPSC amplitude (left) or frequency (right) across NR (normal-reared until P23), DE (dark-exposed for 2 days from P21-P23), and D+L (2 days DE followed by 1 day of light exposure) groups of GluR1-S845A mutants. Middle: Average mEPSC traces from each group. (B) No change in inward rectification index between NR and DE GluR1-S845A mutants. (C) DE did not alter GluR1 or GluR2 levels in the PSD of GluR1-S845A mutants. (D) No alterations in GluR1-S831 phosphorylation in the visual cortex of GluR1-S845A mutants.
Figure 4
Figure 4. Abnormally enhanced GluR1-S845 phosphorylation and synaptic transmission in GluR1-S831A mutants.
(A) Left: Example immunoblots of WT and GluR1-S831A mutant visual cortex samples. Note the lack of phosphorylated S831 (pS831) signal (upper left), while normal expression of GluR1 (as measured with GluR1-C terminal Ab, bottom left blot). S831A mutants display a significant increase in the remaining GluR1-S845 phosphorylation (example blots in the middle panel, quantification in the right graph). *: p<0.01, t-test. (B) Average mEPSC amplitude is increased in S831A mutants (labeled 831) as well as in WT visual cortex slices treated with isoproterenol (Iso). Middle panel: average mEPSC traces from each group. Right panel: Isoproterenol treated group showed a trend of an increase in mEPSC frequency, which did not reach statistical significance (p>0.05, one-factor ANOVA). *: Significantly different from WT at p<0.01 with Fisher's PLSD posthoc test after a one-factor ANOVA. (C) GluR1-S831A mutation did not cause multiplicative scaling of mEPSCs. The amplitude of mEPSCs of S831A-NR (black solid line) shifted to larger values compared to WT-NR (gray solid line). Amplitudes of individual mEPSCs recorded from WT-NR were multiplied by a scaling factor (1.4) to match the average mEPSC amplitude to that of S831A-NR to generate the WT-NR scaled (gray dotted line). However, the cumulative probability curve of WT-NR scaled did not superimpose that of S831A-NR (p<0.01, Kolmogrov-Smirnov test). This suggests that the increase in mEPSC amplitude in GluR1-S831A mutants is not due to multiplicative scaling. (D) Treating WT-NR visual cortex slices with isoproterenol (WT-NR+iso, black solid line) increased mEPSC amplitude as shown by a rightward shift in the curve compared to control WT-NR (gray solid line). We multiplied the amplitude of mEPSCs from WT-NR with a scaling factor (1.5) to match the average mEPSC amplitude of isoproterenol treated group to generate the WT-NR scaled (gray dotted line). The cumulative probability curve of the WT-NR scaled did not overlap with the WT-NR+Iso group (p<0.01, Kolmogrov-Smirnov test).
Figure 5
Figure 5. Comparison of AMPAR regulation in GluR1-S831A mutants and wildtypes treated with isoproterenol.
(A) S831A mutants show increased inward rectification of AMPAR-EPSC evoked upon stimulation of layer 4. Middle: representative traces. Right: I-V curve of WT (gray circles) and S831A (open circles). *: p<0.001, t-test. (B) No changes in GluR1 (left), GluR2 (2nd from left), GluR3 (3rd from left) or GluR1/GluR2 (R1/R2) ratio (right) in isolated PSD fractions of WT and S831A visual cortex. Left panel: Representative blots. (C) Left: Example immunoblots of steady-state biotinylation in isolated layer 2/3 visual cortex slices from wildtype (WT) and S831A mutant (S831A). Different amount of total sample (I, input: 2.5% and 5% of total input each lane), intracellular fraction (S, supernatant), and surface biotinylated fraction (B: 10% and 20% of total biotinylated sample each lane) were loaded to the gel, and probed for GluR1, GluR2, and actin. Right: Quantification of surface GluR1 and GluR2 expressed as a percentage of total GluR1 and GluR2 from each blot. No significant difference in GluR1 or GluR2 was observed between wildtypes and S831A mutants. (D) Left: Example immunoblots of steady-state biotinylation of control (Ctl) and isoproterenol (Iso) treated isolated layer 2/3 visual cortex slices from wildtype. Right: Isoproterenol treatment significantly increased both GluR1 and GluR2 surface levels.
Figure 6
Figure 6. Abnormal visual experience-induced homeostatic synaptic plasticity in GluR1-S831A mutants.
(A) Left: average mEPSC amplitude decreased with dark-exposure (D) and did not decrease any further with re-exposure to light (L). *: Significantly different from NR (N) at p<0.01, Fisher's PLSD posthoc test. Middle: average mEPSC traces from each group. Right: No significant changes in mEPSC frequency across groups. (B) Dark-exposed GluR1-S831A mutants displayed smaller mEPSC amplitudes as seen as a leftward shift in the cumulative probability curve of S831A-DE (black solid line) compared to S831A-NR (gray solid line). To determine whether this is due to multiplicative scaling down of mEPSCs, we multiplied the mEPSC amplitude of S831A-NR with a scaling factor (0.8) to match the average mEPSC amplitude of S831A-DE (S831A-NR scaled, gray dotted line). The cumulative probability curve of S831A-NR scaled did not match that of S831A-DE (p<0.01, Kolmogrov-Smirnov test) suggesting that the decrease in mEPSC size does not follow the rules of multiplicative scaling. (C) Left: GluR1-S831A mutants showed a normal increase in the remaining GluR1-S845 phosphorylation with DE. *: p<0.01, Fisher's PLSD posthoc test. Right: example immunoblots probed simultaneously with pS845 antibody (upper) and GluR1 C-terminal antibody (lower). (D) Left: dark-exposure (DE) GluR1-S831A mutants significantly reduced the inward rectification index. *: p<0.001, t-test. Middle: superimposed representative traces of evoked AMPAR-EPSC for NR and DE taken at −60 mV and +40 mV. Right: DE S831A mutants (black circles) show a more linear I-V curve than NR S831A mutants (open circles). (E) No change in GluR1 (left), GluR2 (middle), or GluR1/GluR2 ratio (right) in the PSD samples of NR and DE S831A mutants.

References

    1. Bellone C, Luscher C. Cocaine triggered AMPA receptor redistribution is reversed in vivo by mGluR-dependent long-term depression. Nat Neurosci. 2006;9:636–641. - PubMed
    1. Clem RL, Barth A. Pathway-specific trafficking of native AMPARs by in vivo experience. Neuron. 2006;49:663–670. - PubMed
    1. Conrad KL, Tseng KY, Uejima JL, Reimers JM, Heng LJ, et al. Formation of accumbens GluR2-lacking AMPA receptors mediates incubation of cocaine craving. Nature. 2008;454:118–121. - PMC - PubMed
    1. Goel A, Jiang B, Xu LW, Song L, Kirkwood A, et al. Cross-modal regulation of synaptic AMPA receptors in primary sensory cortices by visual experience. Nat Neurosci. 2006;9:1001–1003. - PMC - PubMed
    1. Liu Y, Formisano L, Savtchouk I, Takayasu Y, Szabo G, et al. A single fear-inducing stimulus induces a transcription-dependent switch in synaptic AMPAR phenotype. Nat Neurosci. 2010;13:223–231. - PMC - PubMed

Publication types

Substances