. 2011 Mar 31;6(3):e18093.
doi: 10.1371/journal.pone.0018093.

A comprehensive benchmark study of multiple sequence alignment methods: current challenges and future perspectives

Affiliations

A comprehensive benchmark study of multiple sequence alignment methods: current challenges and future perspectives

Julie D Thompson et al. PLoS One. .

Abstract

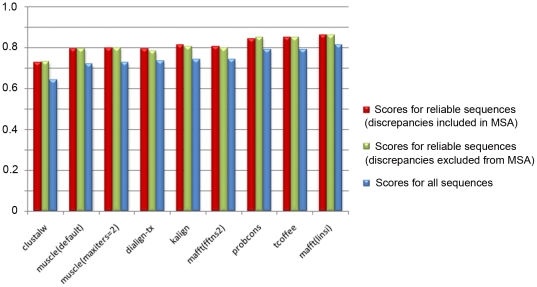
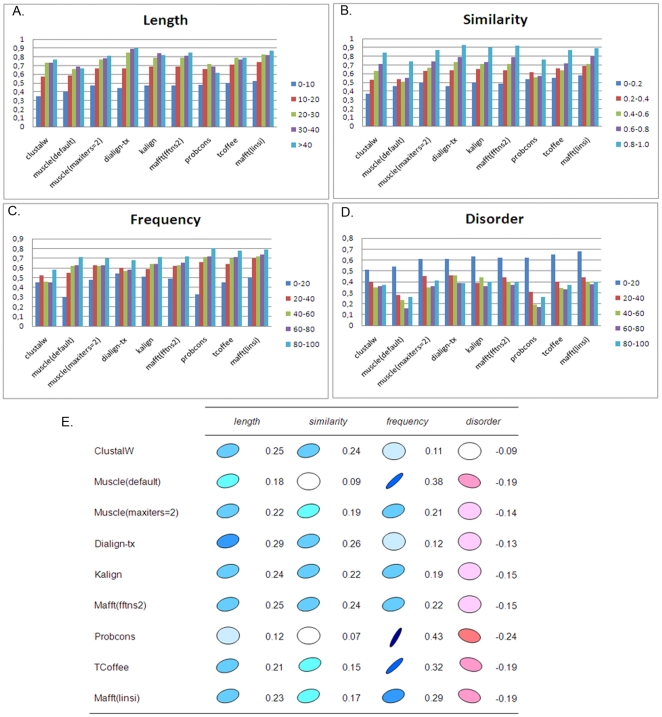
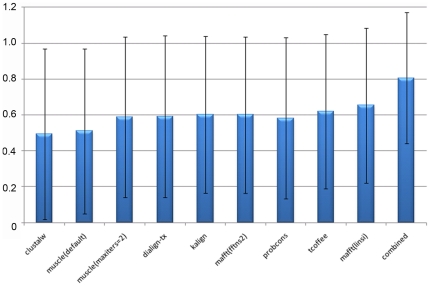
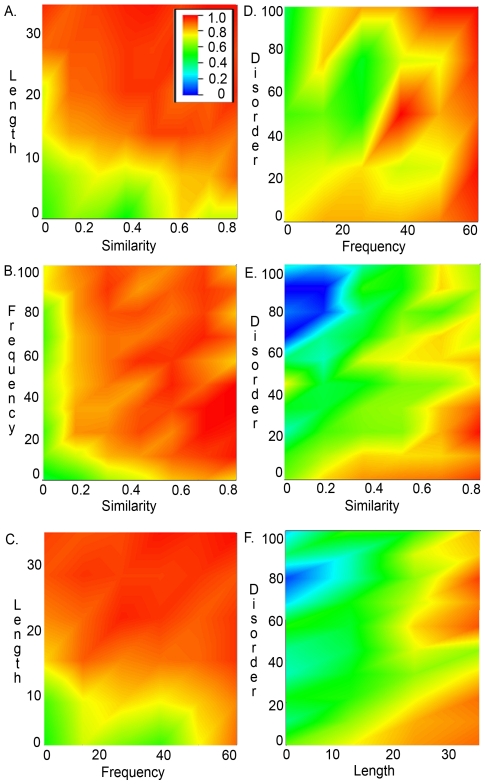
Multiple comparison or alignmentof protein sequences has become a fundamental tool in many different domains in modern molecular biology, from evolutionary studies to prediction of 2D/3D structure, molecular function and inter-molecular interactions etc. By placing the sequence in the framework of the overall family, multiple alignments can be used to identify conserved features and to highlight differences or specificities. In this paper, we describe a comprehensive evaluation of many of the most popular methods for multiple sequence alignment (MSA), based on a new benchmark test set. The benchmark is designed to represent typical problems encountered when aligning the large protein sequence sets that result from today's high throughput biotechnologies. We show that alignmentmethods have significantly progressed and can now identify most of the shared sequence features that determine the broad molecular function(s) of a protein family, even for divergent sequences. However,we have identified a number of important challenges. First, the locally conserved regions, that reflect functional specificities or that modulate a protein's function in a given cellular context,are less well aligned. Second, motifs in natively disordered regions are often misaligned. Third, the badly predicted or fragmentary protein sequences, which make up a large proportion of today's databases, lead to a significant number of alignment errors. Based on this study, we demonstrate that the existing MSA methods can be exploited in combination to improve alignment accuracy, although novel approaches will still be needed to fully explore the most difficult regions. We then propose knowledge-enabled, dynamic solutions that will hopefully pave the way to enhanced alignment construction and exploitation in future evolutionary systems biology studies.


Conflict of interest statement

Competing Interests: The authors have declared that no competing interests exist.

Figures

Figure 1
Figure 1. An example benchmark alignment.
(A) Reference alignment of representative sequences of the p53/p63/p73 family, with the domain organization shown above the alignment (AD: activation domain, Oligo: oligomerization, SAM: sterile alpha motif). Colored blocks indicate conserved regions. The grey regions correspond to sequence segments that could not be reliably aligned and white regions indicate gaps in the alignment. (B) Different MSA programs produce different alignments, especially in the N-terminal region (boxed in red in A) containing rare motifs and a disordered proline-rich domain.
Figure 2
Figure 2. Examples of sequence discrepancies detected.
Four types of sequence discrepancies are identified and highlighted by red boxes in the subfamily alignments. A. Potential mispredicted exons are predicted based on the scores of the conserved core blocks (blue boxes) in the subfamily alignment. Here, the ninth sequence contains a segment ‘outlier’ that scores below the defined threshold for the central core block. The region of the sequence identified as a discrepancy is extended to the nearest core blocks in which the sequence is correctly aligned. B. Potential start and stop site errors are predicted based on the distribution of the positions of the N/C-terminal residues. C. Identification of a potential inserted intron, based on the presence of a single sequence with the insertion in a given subfamily. D. Identification of a potential missing exon, based on the presence of a single sequence with a deletion in a given subfamily.
Figure 3
Figure 3. Overall alignment performance for each of the MSA programs tested.
(A) Overall alignment quality measured using CS. Programs are shown ranked by increasing quality scores. Error bars correspond to one standard deviation.(B) Total run time for constructing all alignments (a log10 scale is used for display purposes).
Figure 4
Figure 4. Factors affecting overall alignment quality.
Average alignment quality scores (CS) for each MSA program tested and for eachglobal alignment attribute:(A) CS versus NorMD, (B) CS versus the percentage of the alignment covered by the blocks, (C) CS versus mean sequence length, (D) CS versus the total number of sequences.(E) Pearson correlation coefficients of overall quality scores (CS) for each program with global alignment attributes (blue: positive correlation, red: negative correlation).
Figure 5
Figure 5. Comparison of alignment quality scores for sequence sets with and without potential error sequences.
Quality scores (CS) for alignment of reliable sequences when discrepancies are included in the alignment set are shown in red. Quality scores for the same set of sequences when discrepancies are removed from the alignment set are shown in green. Scores for all sequences (from figure 2) are shown (in blue) for comparison purposes.
Figure 6
Figure 6. Factors affecting individual block alignment quality.
Average block scores (BCS) for each MSA program and for each block attribute:(A) BCS versus similarity ( = 1-MD) of the sequences in the block, (B) BCS versus block length: average residue length of the block, (C) BCS versus frequency of occurrence of the block in the alignment, (D) BCS versus disorder: percentage of residues in natively disordered regions compared to folded domains.(E) Correlation of individual block scores (BCS)for each program with the various block attributes.
Figure 7
Figure 7. Comparison of block scores obtained by the different alignment programs.
Mean block scores for the individual programs vary between 0.49 and 0.65. Combining the results from each program leads to an increased mean score of 0.81.Error bars correspond to one standard deviation. Asterisks indicate significant differences between the scores according to pairwise t-tests (significance level 0.05).
Figure 8
Figure 8. Alignability of blocks depends on various attributes.
By combining 8 different MSA programs, a majority of blocks can be well aligned (red regions in the heat maps), but certain blocks remain problematic (blue, green regions). (A) Short blocks (<10 residues) with low similarity (<0.5) are aligned with 40–60% accuracy. (B) The frequency of occurrence in the alignment plays an important role. Blocks that occur in a majority of the sequences, even very divergent ones, are generally well aligned. (C) Short blocks (<10 residues) that occur in a majority of the sequences are also well aligned. (D to F) Blocks in natively disordered regions are generally less well aligned than those in folded regions, and short, divergent blocks are misaligned by all programs (blue regions).
Figure 9
Figure 9. General statistics computed for the benchmark alignments.
In the box-and-whisker plots, boxes indicate lower and upper quartiles, and whiskers represent minimum and maximum values. Blue boxes correspond to the alignment of all sequences. Red boxes correspond to the alignments containing only reliable sequences, with no identified sequence discrepancies.

References

    1. Harvey PH, Pagel MD. Oxford University Press Paris; 1991. The Comparative Method in Evolutionary Biology.
    1. Dunn CW, Hejnol A, Matus DQ, Pang K, Browne WE, et al. Broad phylogenomic sampling improves resolution of the animal tree of life. Nature. 2008;452:745–749. - PubMed
    1. Bao Y, Bolotov P, Dernovoy D, Kiryutin B, Zaslavsky L, et al. The influenza virus resource at the National Center for Biotechnology Information. J Virol. 2008;82:596–601. - PMC - PubMed
    1. Kuipers RK, Joosten HJ, van Berkel WJ, Leferink NG, Rooijen E, et al. 3DM: systematic analysis of heterogeneous superfamily data to discover protein functionalities. Proteins. 2010;78:2101–2113. - PubMed
    1. Singh S, Tokhunts R, Baubet V, Goetz JA, Huang ZJ, et al. Sonic hedgehog mutations identified in holoprosencephaly patients can act in a dominant negative manner. Hum Genet. 2009;125:95–103. - PMC - PubMed

Publication types

MeSH terms