. 2011 Jul;41(7):1902-12.
doi: 10.1002/eji.201141417.

ST2 deletion enhances innate and acquired immunity to murine mammary carcinoma

Affiliations
Free PMC article

ST2 deletion enhances innate and acquired immunity to murine mammary carcinoma

Ivan Jovanovic et al. Eur J Immunol. 2011 Jul.
Free PMC article

Abstract

ST2 is a member of the IL-1 receptor family and IL-33 was recently identified as its natural ligand. The IL-33/ST2 pathway regulates Th1/Th2 immune responses in autoimmune and inflammatory conditions, but the role of ST2 signaling in tumor growth and metastasis has not been investigated. We aimed to investigate whether ST2 gene deletion affects tumor appearance, growth, and metastasis, and antitumor immunity in an experimental metastatic breast cancer model. Deletion of ST2 in BALB/c mice bearing mammary carcinoma attenuated tumor growth and metastasis, which was accompanied by increased serum levels of IL-17, IFN-γ, and TNF-α and decreased IL-4. Tumor-bearing ST2-/- mice had significantly higher percentages of activated CD27high CD11bhigh NK cells, CD69+ and KLRG- NK cells and higher cytotoxic activity of splenocytes, NK cells, and CD8+ T cells in vitro. A significantly higher number of NK cells expressing IFN-γ were found in ST2-/- mice compared with WT recipients. In vivo depletion of CD8+ or NK cells revealed a key role for NK cells in enhanced antitumor immunity in ST2-/- mice. We report for the first time that suppressed breast cancer progression and metastasis in mice lacking ST2 corresponds mainly with enhanced cytotoxic activity of NK cells, and increased systemic Th1/Th17 cytokines.


Figures

Figure 1
Figure 1
ST2 deletion attenuates tumor growth and metastasis. (A) WT (n=7, black bars) and ST2−/− mice (n=12, white bars) were inoculated with 5×10⁴ 4T1 breast tumor cells. Palpable tumors were monitored for 36 days. Black line, WT mice; grey line, ST2−/− mice. Tumor diameters were measured every day. Tumor volumes were determined on day 36 from the inoculation of 4T1 tumor cells. Data are presented as mean+SEM from two experiments. Statistical significance was tested by Mann–Whitney Rank Sum test or Student's unpaired t-test, where appropriate (*p<0.05; **p<0.01). (B) Paraffin-embedded lung and liver tissues were stained with hematoxylin and eosin (H&E) and examined by light microscopy for the number and size of metastatic colonies. H&E-stained sections (4 μm) from at least three different levels were examined. Data are presented as mean+SEM from two experiments. Statistical significance was tested by Mann–Whitney Rank Sum test or Student's unpaired t-test, where appropriate (*p<0.05). (C) Light-microscopic pictures (magnification, 10×) through pulmonary and liver tissue sections showing metastatic colonies (arrows).
Figure 2
Figure 2
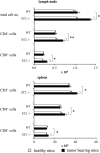
Flow cytometric analysis of the local lymph node and spleen T cells. Total cell number of local lymph nodes and spleens were determined in healthy and tumor-bearing WT and ST2−/− mice on day 13 after inoculation of 4T1 tumor cells. Percentages and absolute numbers of CD3+, CD4+, and CD8+ cells were determined by staining local lymph node or spleen cell suspensions with fluorochrome-labeled Abs and analyzed by a FACSAria flow cytometer (BD Biosciences). Mononuclear cells were gated on by size and granularity on FSC/SSC. Data are presented as mean+SEM of two separate experiments, each carried out with four mice per group. Statistical significance was tested by Student's t-test (*p<0.05; **p<0.01).
Figure 3
Figure 3
ST2-deficiency enhances systemic Th1/Th17 cytokine levels in mice with established tumors. Serum levels of IL-17, IFN-γ, IL-4, and TNF-α in healthy and tumor-bearing WT and ST2−/− mice were determined by ELISA at day 36 after inoculation of 4T1 tumor cells. Data are presented as mean+SD from at least five mice per group. Statistical significance was tested by Student's t-test (*p<0.05;**p<0.01).
Figure 4
Figure 4
Flow cytometric analysis of NK cell surface markers and intracellular IFN-γ/IL-10 in spleens of tumor bearing ST2−/− and WT mice. (A) The percentages and absolute numbers of CD3CD19NKp46+ cells in spleens of healthy and tumor-bearing WT and ST2−/− mice were determined on day 13 after tumor inoculation by using fluorochrome-labeled Abs and analyzed on a FACS Aria. Mononuclear cells were gated on by size and granularity on FSC/SSC. Results are presented as mean+SEM from eight mice per group (*p<0.05). (B) Following surface staining for NKp46 cell marker, splenic cells were permeabilized and intracellular staining of IFN-γ (12 mice per group) and IL-10 (four mice per group) in WT and ST2−/− mice, prior to and on day 13 after tumor inoculation were performed. Data represent mean+SEM from two separate experiments. Statistical significance was determined by Student's t-test (*p<0.05).
Figure 5
Figure 5
Cytotoxic activity of total splenocytes, NK cells, and CD8+ T cells. (A) The cytotoxic activity of effector cell populations was tested in a 4-h MTT assay against 4T1 cell targets, at four different T:E ratios at day 13. The data are presented as mean percentages of specific cytotoxicity and LU20/107 NK cells, which was calculated on the basis of mean percentages of killing in four different T:E ratios and percentages of effector cells. Data are means+SEM of two individual experiments, each carried out with three mice per group. Statistical significance was tested by Student's t-test (*p<0.05; **p<0.01). (B) Flow cytometric analysis of CD107a expression on NKp46+ and CD8+ cells. Data are means+SEM of two individual experiments, each carried out with three mice per group. Statistical significance was tested by Student's t-test (*p<0.05).
Figure 6
Figure 6
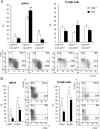
Phenotype of NK cells derived from spleen and local lymph nodes of ST2−/− and WT mice. (A) The percentages and absolute numbers of activated CD27highCD11bhigh NK cells, as well as immature CD27high CD11blow NK cells and mature CD27low CD11bhigh NK cells in the spleen and local lymph nodes of healthy and tumor-bearing WT and ST2−/− mice at day 13 after tumor inoculation were determined by flow cytometry. Representative dot plots defining CD27high/CD27low and CD11b+/−CD3CD19NKp46+ cells are shown. (B) The percentages and absolute numbers of CD69+ and KLRG1 NK cells in the spleens and local lymph nodes of healthy and tumor-bearing WT and ST2−/− mice at day 13 after tumor inoculation were determined by flow cytometry. Representative flow cytometry dot plots show percentages of CD69+ and KLRG CD3CD19NKp46+ cells in spleens and local lymph nodes from ST2−/− and WT mice. Data are mean+SD from four mice per group. Statistical significance was determined by Student's t-test (p<0.05; **p<0.01).
Figure 7
Figure 7
Tumor growth after in vivo depletion of CD8+ and NK cells. (A) Mice were injected with 5×10⁴ 4T1 tumor cells and primary tumor growth was evaluated by measuring tumor diameters on day 17 after tumor inoculation in CD8+ cell-depleted WT and ST2−/− mice. Representative flow cytometry dot plot shows the percentages of CD8+ cells after in vivo administration of anti-CD8 mAb (YTS 169.4, left panel). Data are mean+SD from four mice per group. Statistical significance was determined by Student's t-test (*p<0.05). (B) Mice were injected with 5×10⁴ 4T1 tumor cells and primary tumor growth was evaluated by measuring tumor diameters on day 17 after tumor inoculation in NK-depleted WT and ST2−/− mice. Representative flow cytometry dot plot shows the percentages of NK cells after in vivo administration of antiasialo GM1 mAb (left panel). Data are mean+SD from four mice per group.

References

    1. Klemenz R, Hoffmann S, Werenskiold AK. Serum- and oncoprotein-mediated induction of a gene with sequence similarity to the gene encoding carcinoembryonic antigen. Proc. Natl. Acad. Sci. USA. 1989;86:5708–5712. - PMC - PubMed
    1. Tominaga S. A putative protein of a growth specific cDNA from BALB/c-3T3 cells is highly similar to the extracellular portion of mouse interleukin 1 receptor. FEBS Lett. 1989;258:301–304. - PubMed
    1. Liew FY, Pitman NI, McInnes IB. Disease-associated function of IL-33: the new kid in the IL-1 family. Nat. Rev. Immunol. 2010;10:103–110. - PubMed
    1. Tago K, Noda T, Hayakawa M, Iwahana H, Yanagisawa K, Yashiro T, Tominaga S. Tissue distribution and subcellular localization of a variant form of the human ST2 gene product, ST2V. Biochem. Biophys. Res. Commun. 2001;285:1377–1383. - PubMed
    1. Trajkovic V, Sweet MJ, Xu D. T1/ST2-an IL-1 receptor-like modulator of immune responses. Cytokine Growth Factor Rev. 2004;15:87–95. - PubMed

Publication types

MeSH terms

LinkOut - more resources