. 2011 Oct 15;519(15):2954-77.
doi: 10.1002/cne.22648.

Sexually dimorphic expression of hypothalamic estrogen receptors α and β and Kiss1 in neonatal male and female rats

Affiliations

Sexually dimorphic expression of hypothalamic estrogen receptors α and β and Kiss1 in neonatal male and female rats

Jinyan Cao et al. J Comp Neurol. .

Abstract

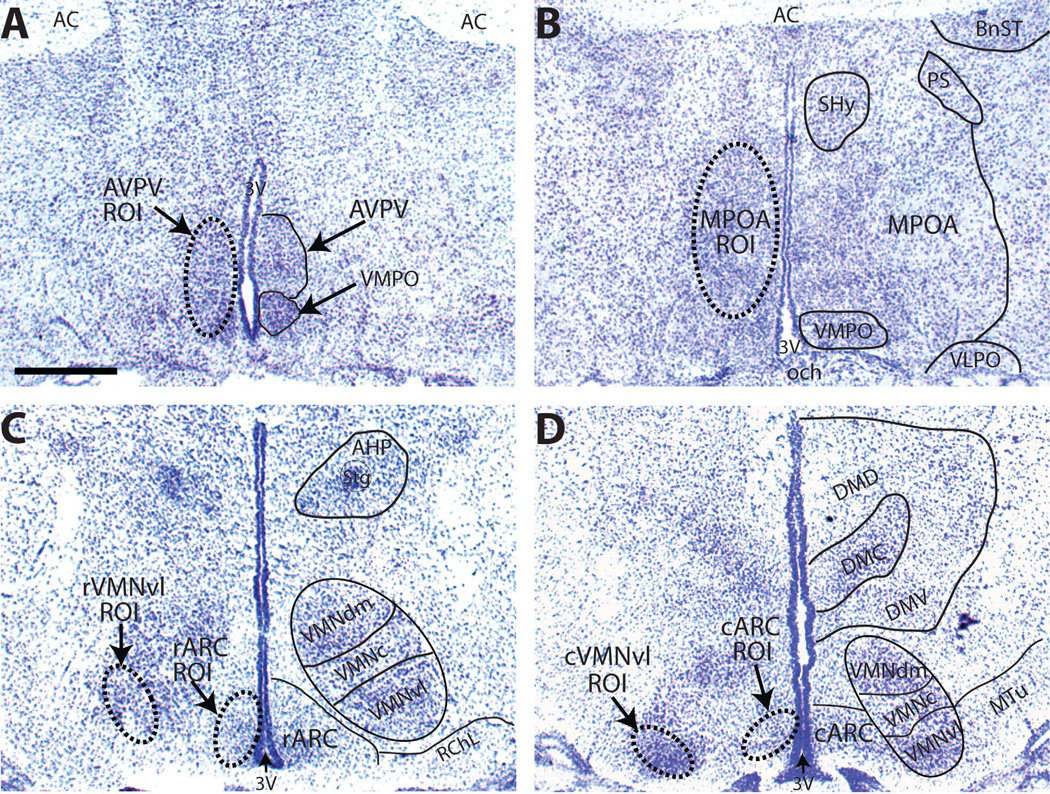
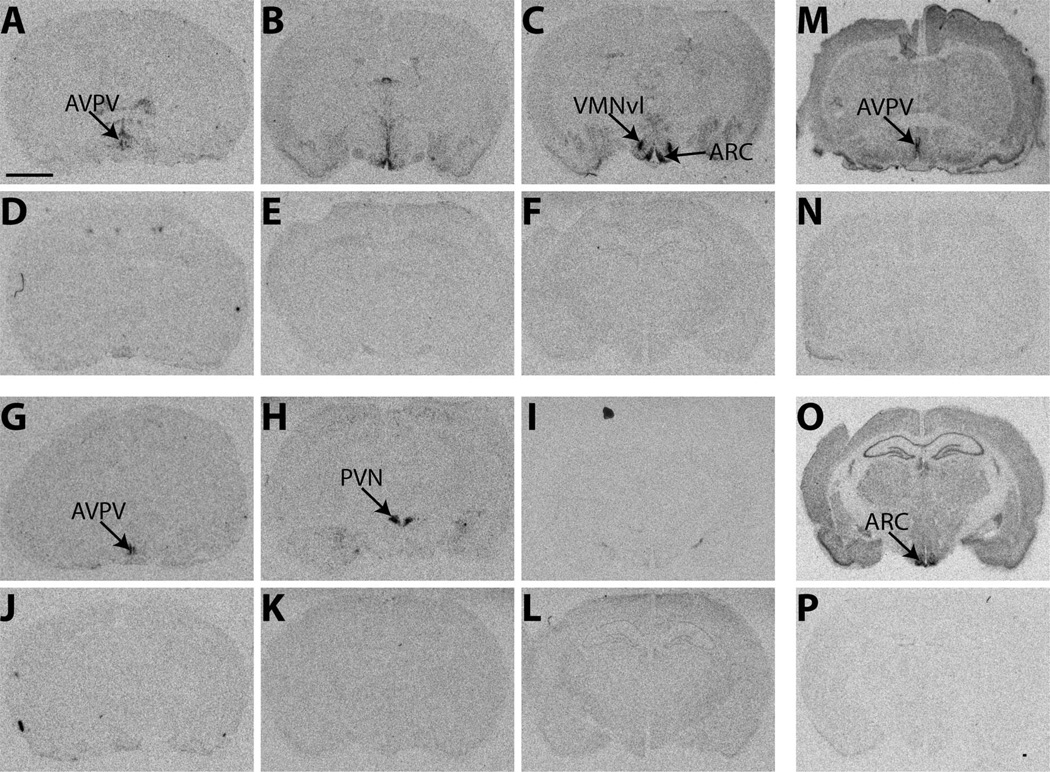
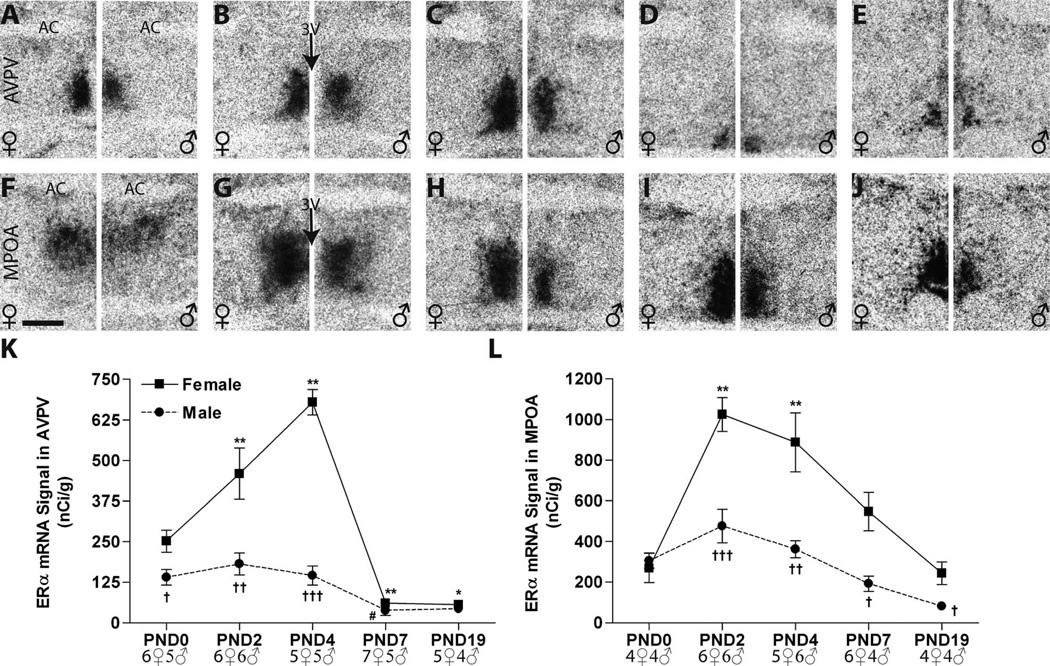
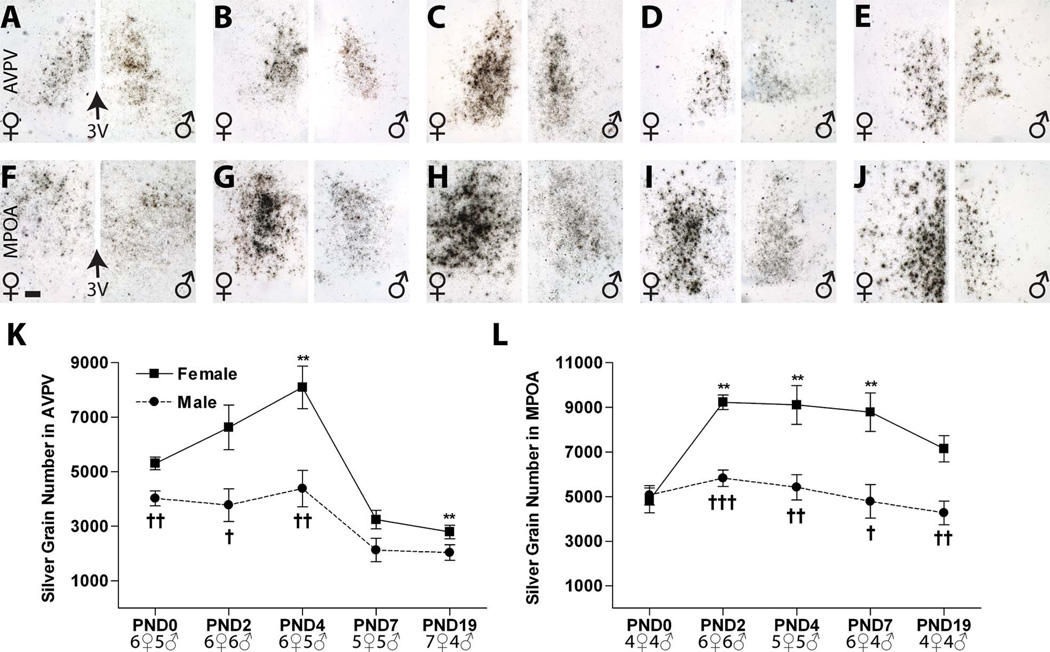
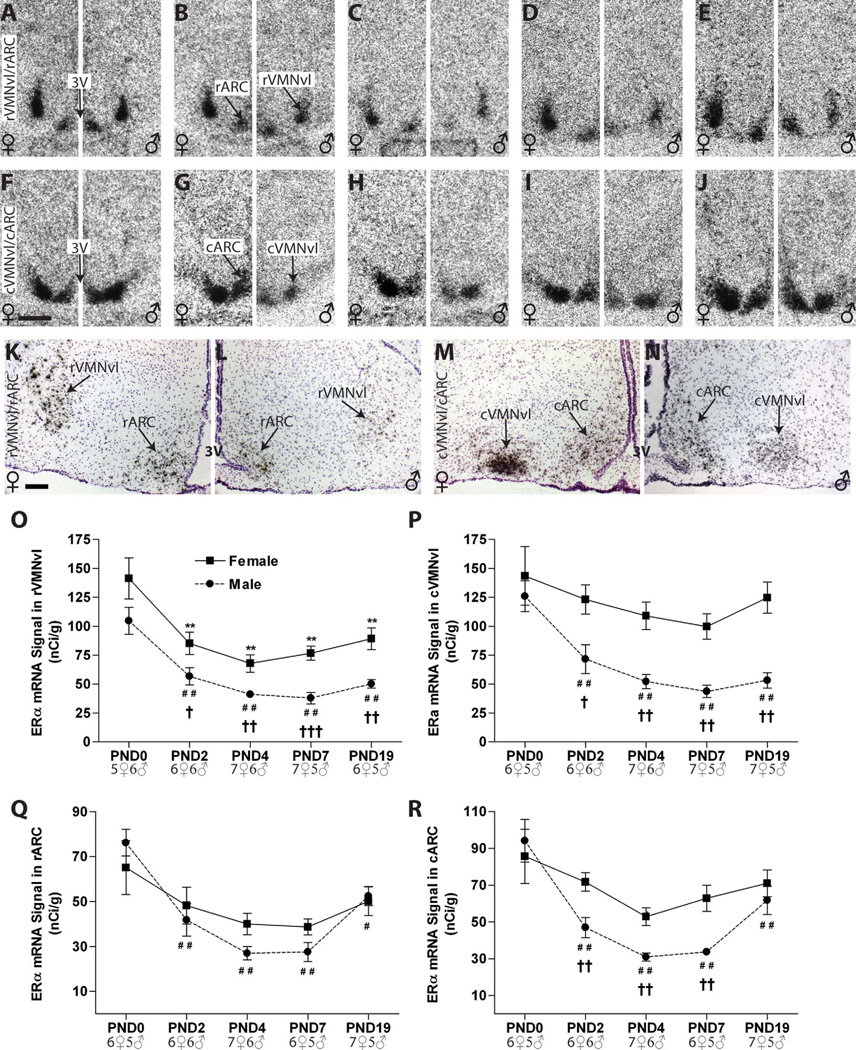
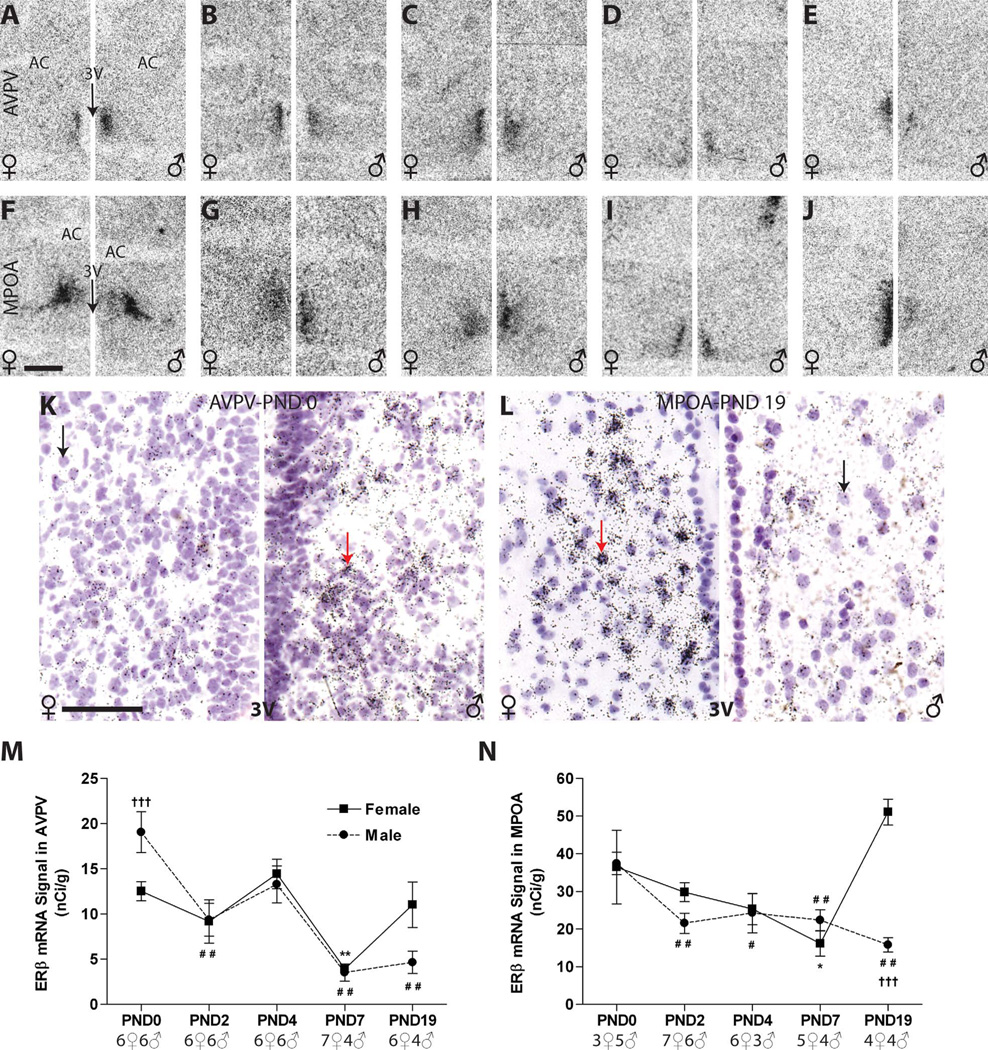
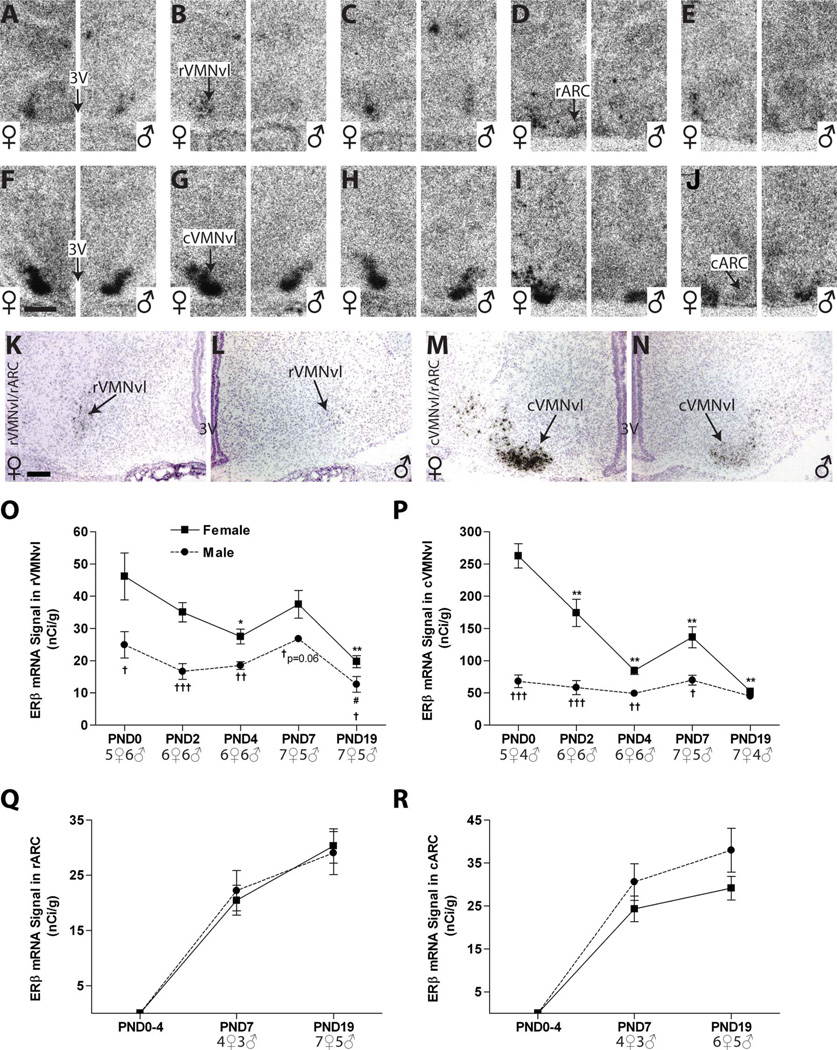
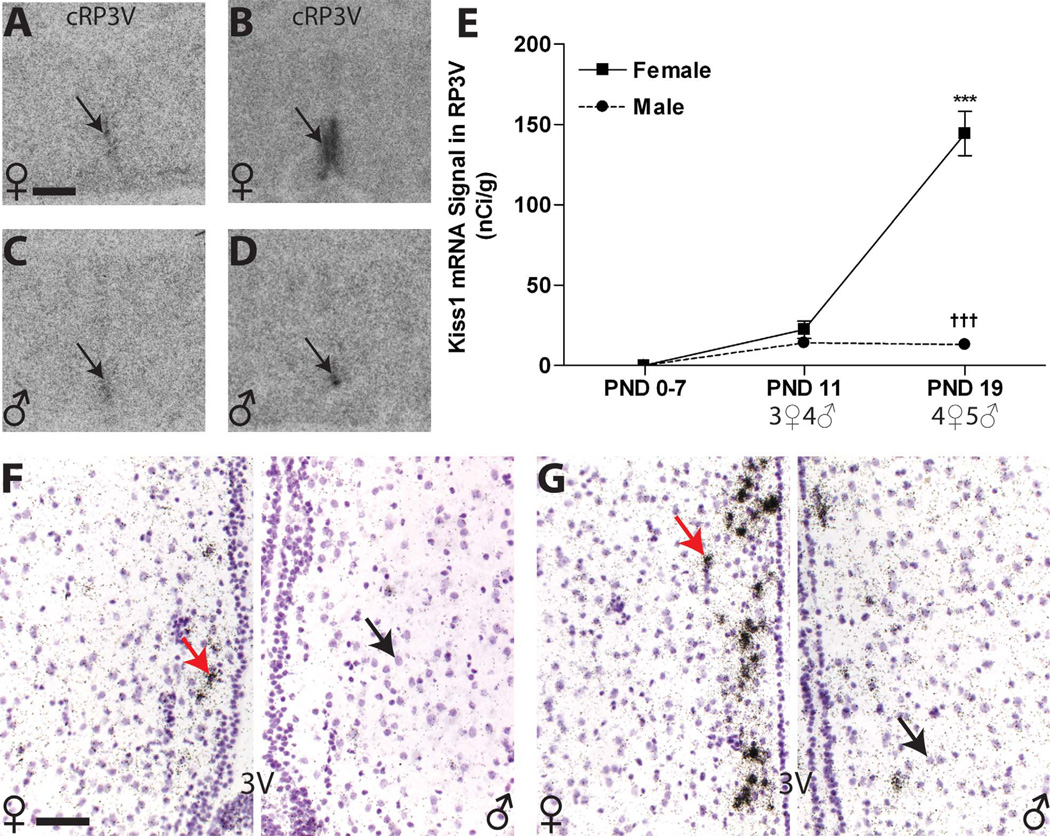
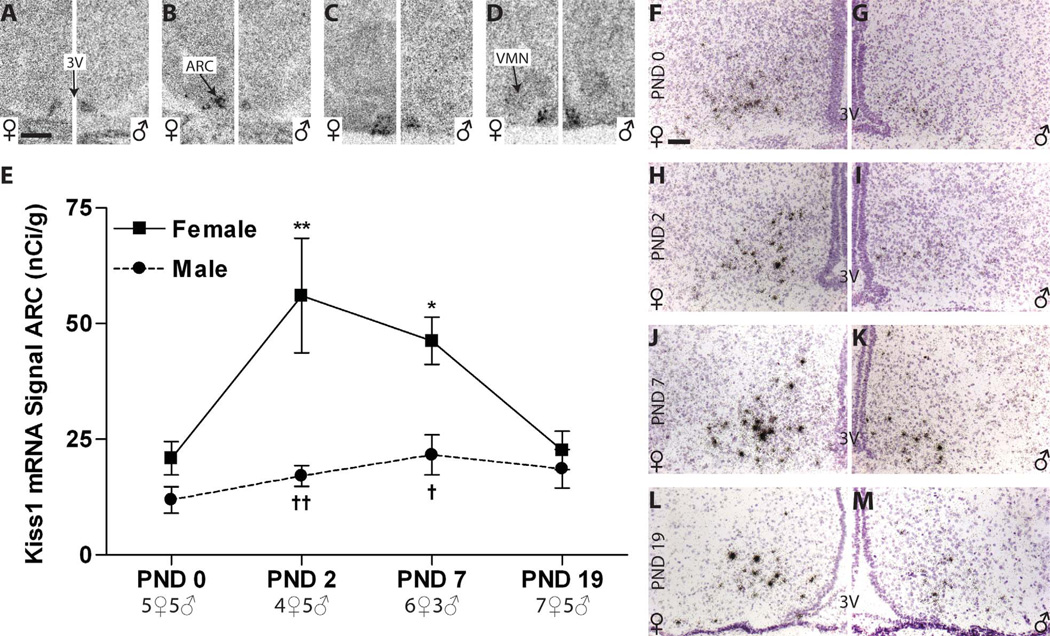
Release of gonadotropins in adult rodents is sex specific and dependent upon kisspeptin (Kiss1) neurons. This crucial pathway within the hypothalamic-pituitary-gonadal (HPG) axis is profoundly influenced by neonatal estrogens, which induce a male-like phenotype. Classically, estrogen activity is mediated via the estrogen receptors α and β (ERα and ERβ), but the relative roles each plays in organizing the sex-specific ontogeny of kisspeptin signaling pathways remain unresolved. Thus, the present study used in situ hybridization histochemistry (ISHH) to map the temporal and sexually dimorphic neonatal mRNA expression profiles of ERα, ERβ, and Kiss1 in the anterioventral periventricular nucleus (AVPV), medial preoptic area (MPOA), ventromedial nucleus (VMN), and arcuate nucleus (ARC), all regions critical for kisspeptin regulation of gonadotropin secretion. In general, females had higher levels of ERα, in all regions examined, a sex difference that persisted until postnatal day (PND) 19 except in the ARC. Males had significantly more ERβ expression in the AVPV at birth, but this sex difference was lost and then re-emerged on PND 19, with females having more than males. VMN ERβ levels were higher in females until PND 19. Kiss1 was not detectable until PND 11 in the anterior hypothalamus, but expression levels were equivalent at birth in the ARC. By PND 2, ARC ERα and Kiss1 levels were abundant, sexually dimorphic (higher in females), and, respectively, showed a U- and a bell-shaped pattern with age. Sex differences in ARC Kiss1 expression provide evidence that Kiss1 may play a role in the sexual dimorphic organization of the neonatal brain. These detailed profiles of neonatal Kiss1 and ERs mRNA levels will help elucidate the relative roles each plays in the sex-specific, estrogen-dependent organization of gonadotropin signaling pathways.


Figures

Figure 1
Figure 1
Representative NISSL-stained sections from PND 2 females depicting the anatomical landmarks (right side of each panel) used to identify each brain area of interest and the corresponding sampling template created to define the region of interest (ROI; dashed oval; left side of each panel) and used to quantify the autoradiographic signal within that brain area. Because the size and position of each brain area change with age, an ROI was developed for each age and then used for all sections, regardless of sex, within that age group. Depicted is a midlevel section of the AVPV (A), and MPOA (B), a representative section containing both the rVMNvl and the rARC (C), and a section containing both the cVMNvl and cARC (D). All sections were obtained from animals in our existing colony to match against the hybridized tissue used for the present studies. For abbreviations, see list. Scale bar = 500 µm in A (applies to A–D). [Color figure can be viewed in the online issue, which is available at wileyonlinelibrary.com.]
Figure 2
Figure 2
Representative autoradiographic images depicting the specificity of the 35S-labeled cRNA probes of ERα, ERβ, and Kiss1 in the adult female rat brain. A–C: Labeling for ERα, was visible in the AVPV (A), ARC (C), and VMNvl (C), all regions known to contain ERα, but not the PVN (B), a region known to be devoid of ERα. G–I: Labeling for ERβ was robust in the AVPV (G) and PVN (H) but not the VMNvl (I), a region devoid of ERβ in adulthood. M,O: Kiss1 labeling was confined to the AVPV (M) and, caudally, within the RP3V, along with the ARC (O), as expected. No signal above background was present on any of the autoradiographs generated with the sense probes. D–F: ERα sense labeling. J–L: ERβ sense labeling. N,P: Kiss1 sense labeling. For abbreviations, see list. Scale bar = 2 µm in A (applies to A–P).
Figure 3
Figure 3
Representative autoradiographic images depicting ERα mRNA signal in the neonatal rat anterior hypothalamus of both sexes (females on the left side of each panel, males on the right). A–E: Within the AVPV, labeling intensified in the females (left sides) from birth (A) through PNDs 2 (B) and 4 (C), then appreciably declined by PND 7 (D), and remained low on PND 19 (E). In males (right sides), signa was also robust, but intensity remained relatively flat across the neonatal period until PND 7. F–J: Signal was readily detectable at all ages examined in the MPOA but was appreciably more intense within the first 4 days of life (F–H). A pronounced sex difference was observable on all days except PND 0 (G–J). K,L: Expression intensity, as measured by optical density, was sexually dimorphic in both the AVPV and MPOA by PND 2 but declined in magnitude after PND 4 to where the sex difference was abolished by PND 7 in the AVPV but remained significant in the MPOA through PND 19. Significant differences in expression compared with PND 0 levels are represented by (*) P ≤ 0.05, (**) P ≤ 0.01 for the females, and (#) P ≤ 0.05, for the males. Statistically significant sex differences in expression at each age are represented by (†) P ≤ 0.05, (††) P ≤ 0.01, and (†††) P ≤ 0.001. The sample size for each group is presented in the graphs, and the data points represent mean ± SEM. For abbreviations, see list. Scale bar = 500 µm in F (applies to A-J).
Figure 4
Figure 4
Deposition of silver grain labeling for ERα mRNA in the neonatal rat anterior hypothalamus (females on the left side of each panel, males on the right). A–J: The representative photomicrographs depict labeling in the (A–E) AVPV and (F–J) MPOA from PND 0–19. In all cases, labeling consisted of discrete clusters of silver grains with very little background labeling. Notably (F), on PND 0, label within the MPOA was largely confined to the dorsal portion of the MPN. K,L: Quantification of silver grain deposition revealed a significant sex difference in ERα mRNA levels by PND 2 in both regions. This sex difference was eliminated by PND 7 in the AVPV, but persisted through PND 19 in the MPOA. Significant differences in expression compared with PND 0 levels are represented by (**) P ≤ 0.01, for the females. (No significant change with age was observed in the males.) Significant sex differences in expression at each age are represented by (†) P ≤ 0.05, (††) P ≤ 0.01, and (†††) P ≤ 0.001. The graphs depict mean ± SEM, and the sample size at each age is provided at the bottom. For abbreviations, see list. Scale bar = 100 µm in F (applies to A–J). [Color figure can be viewed in the online issue, which is available at wileyonlinelibrary.com.]
Figure 5
Figure 5
Autoradiographs depicting ERα mRNA labeling in the ARC and VMNvl of male and female neonatal rats (females on the left side of each panel, males on the right). A–J: Labeling in the (A–E) rVMN and rARC and (F–J) cVMN and cARC was robust and tightly confined to the regions of interest in both sexes at all ages examined. K–N: Representative hemotoxylin-counterstained sections depicting deposition of silver grain labeling for ERα in the mediobasal hypothalamus of PND 19 females (K,M) and males (L,N). Signal in the VMN was appreciably more robust than in the ARC. Label was visible as dark, discrete clusters of silver grains localized on counterstained nuclei. Qualitative assessment revealed that the temporal and sexual dimorphic pattern of labeling was congruous to that observed on the autoradiographs. O–R: A significant sex difference in ERα expression was present in all regions except the rARC by PND 2. By PND 19, the sex difference in the VMN remained but was lost in the ARC. Expression intensity of ERα mRNA in the rVMNvl of both sexes decreased between PNDs 0 and 2 then remained relatively stable. In the cVMNvl, levels declined with age in males but remained comparatively flat in females. In the male ARC, temporal expression of ERα was “U-shape” with the nadir on or near PND 7. In contrast, expression levels remained stable in females, with no significant effect of age in either subregion. A main effect of sex was identified in the cARC, but not the rARC, with females having higher levels of expression than males on PNDs 2, 4, and 7 in the cARC. Significant differences in expression compared with PND 0 levels are represented by (**) P≤ 0.01 for the females, and (#) P≤ 0.05, (###) P≤ 0.01, for the males. Significant sex differences in expression are represented by (†) P≤ 0.05, (††) P≤ 0.01, and (†††) P ≤ 0.001 at each age. The graphs depict mean ± SEM, and the sample size is provided for each age. For abbreviations, see list. Scale bar = 500 µm in F (applies to A–J); 100 µm in K (applies to K–N). [Color figure can be viewed in the online issue, which is available at wileyonlinelibrary.com.]
Figure 6
Figure 6
A–J: Autoradiographs showing ERβ mRNA expression in the RP3V of male and female neonatal rats (females on the left side of each panel, males on the right). Signal was relatively weak at all ages examined but distinguishable from background and quantifiable by optical density in the AVPV (A–E) and MPOA (F–J). The pattern of autoradiographic labeling was confirmed by observing silver grain deposition on the emulsion-dipped, counterstained slides. K,L: Label appeared as tight clusters (gray arrows) over the counterstained nuclei (black arrows). ERβ expression was sexually dimorphic at birth in the AVPV (A,K,M) with males (right panel of A,K) having significantly higher expression levels than females (left panel of A,K). This sex difference was rapidly lost, and no sex difference was observed until PND 19 (M,N), at which point females had significantly more ERβ signal than males in the MPOA (J,L), but only a trend for a difference was observed in the AVPV (E; P = 0.09). M,N: In both sexes, ERβ expression was notably lower on PND 7, compared with PND 0, but levels recovered in both regions by PND 19 in females. For the females, significant differences in temporal expression levels are represented by (*) P ≤ 0.05 and (**) P ≤ 0.01, compared with PND 0. For the males, significant differences in expression from PND 0 are indicated by (#) P ≤ 0.05 and (###) P ≤ 0.01. Significant sex differences are represented by (†) P ≤ 0.05, (††) P ≤ 0.01, and (†††) P ≤ 0.001. The sample size for each age is indicated on the graphs, and the data points represent mean ± SEM. For abbreviations, see list. Scale bar = 500 µm in F (applies to A–J); 50 µm in K (applies toK,L). [Color figure can be viewed in the online issue, which is available at wileyonlinelibrary.com.]
Figure 7
Figure 7
Representative autoradiographic and photomicrographs depicting ERβ labeling in the mediobasal hypothalamus (females on the left side of each panel, males on the right). A–J: ERβ signal on the autoradiographs was appreciably weaker in the (A–E) rVMNvl compared with the (F–J) cVMNvl and was virtually absent in the ARC (A–J). K–N: Silver grain deposition following emulsion dipping revealed few, but prominent, silver grain clusters in the rVMNvl on PND 2 and more intense labeling in the cVMNvl (K–N), particularly in females (K,M). O,P: Quantification by optical density revealed a significant sex difference in ERβ expression on PND 0 in both VMNvl subregions, the magnitude of which diminished overtime in the cVMNvl, and was eliminated in both subregions by PND 19. Expression intensity remained relatively flat in the males across neonatal development throughout the VMNvl but declined significantly and steadily in the female cVMNvl. Q,R: No signal was detected in the ARC on the autoradiograms until PND 7. Although expression was very low between PND 7 and 19, it was discernable above background (D,E,I,J) and quantification by optical density found no appreciable sex difference. Significant differences in expression, as measured by optical density, compared with PND 0 are represented by (*) P ≤ 0.05 and (**) P ≤ 0.01 for the females and (#) P ≤ 0.05 for the males. Significant sex differences at each age are indicated by (†) P ≤ 0.05, (††) P ≤ 0.01, and (†††) P ≤ 0.001. The sample size for each age is provided on the graphs, and the data points represent mean ± SEM. For abbreviations, see list. Scale bar = 500 µm in F (applies to A –J); 100 µm in K (applies to K–N). [Color figure can be viewed in the online issue, which is available at wileyonlinelibrary.com.]
Figure 8
Figure 8
A–D: Kiss1 signal in the RP3V autoradiographs was not detectable until PND 11 (black arrow; A,C) and sexually dimorphic at PND 19 (B,D,E). E: Quantification of signal by optical density revealed a significant sex difference in expression on PND 19 across the entire RP3V due to a significant increase in female expression. F,G: Qualitative assessment of silver grain deposition on the emulsion-dipped, counterstained slides revealed that, on PND 19, labeling was clustered (arrows on the left sides) around the labeled nuclei (arrows on the right sides) and primarily confined to a narrow region adjacent to the third ventricle (3V) but less robust in the rostral portion of the RP3V (F) in both sexes (female on the left, male on the right) compared with the caudal portion (G; female on the left, male on the right) . Significant differences in expression, compared with PND 0 are represented by (***) P ≤ 0.001 for the females. Significant sex differences at P19 are indicated by (†††) P ≤ 0.001. The sample size for each age is shown on the graph, and the data points represent mean ± SEM. For abbreviations, see list. Scale bar = 500 µm in A (applies to A–D); 50 µm in F (applies to F,G). [Color figure can be viewed in the online issue, which is available at wileyonlinelibrary.com.]
Figure 9
Figure 9
Kiss1 expression in postnatal rat mediobasal hypothalamus. A–D, F–M: Representative autoradiographs (A–D) and photomicrographs (F–M) revealed discrete signal on all days examined in both sexes. In addition, a weak signal can be seen in the VMN on PNDs 7 and 19 (C,D). E: ARC expression levels increased in females between PND 0 and 7 but then dipped on PND 19. Levels in males remained comparatively unchanged across all days examined. A significant sex difference in Kiss1 expression was present on PNDs 2 and 7 but disappeared, due to declining levels in females by PND 19. Significant differences in expression, compared with PND 0, are represented by (*) P ≤ 0.05 and (**) P ≤ 0.01 for the females. No effect of age was found in the males. Significant sex differences at each age are indicated by (†) P ≤ 0.05 and (††) P ≤ 0.01. The sample size for each age is indicated on the graphs, and the data points represent mean ± SEM. For abbreviations, see list. Scale bar = 500 µm in A (applies to A–D); 50 µm in F (applies to F–M). [Color figure can be viewed in the online issue, which is available at wileyonlinelibrary.com.]

Similar articles

Cited by

References

    1. Amateau SK, Alt JJ, Stamps CL, McCarthy MM. Brain estradiol content in newborn rats: sex differences, regional heterogeneity, and possible de novo synthesis by the female telencephalon. Endocrinology. 2004;145:2906–2917. - PubMed
    1. Arai Y, Gorski RA. Critical exposure time for androgeni-zation of the developing hypothalamus in the female rat. Endocrinology. 1968;82:1010–1014. - PubMed
    1. Arnold AP, Gorski RA. Gonadal steroid induction of structural sex differences in the central nervous system. Ann Rev Neurosci. 1984;7:413–442. - PubMed
    1. Bateman HL, Patisaul HB. Disrupted female reproductive physiology following neonatal exposure to phytoestro-gens or estrogen specific ligands is associated with decreased GnRH activation and kisspeptin fiber density in the hypothalamus. Neurotoxicology. 2008;29:988–997. - PMC - PubMed
    1. Brown NM, Setchell KD. Animal models impacted by phytoestrogens in commercial chow: implications for pathways influenced by hormones. Lab Invest. 2001;81:735–747. - PubMed

Publication types