

Evaluation of specific metabolic rates of major organs and tissues: comparison between men and women
- PMID: 21484913
- PMCID: PMC3139779
- DOI: 10.1002/ajhb.21137
Evaluation of specific metabolic rates of major organs and tissues: comparison between men and women
Abstract
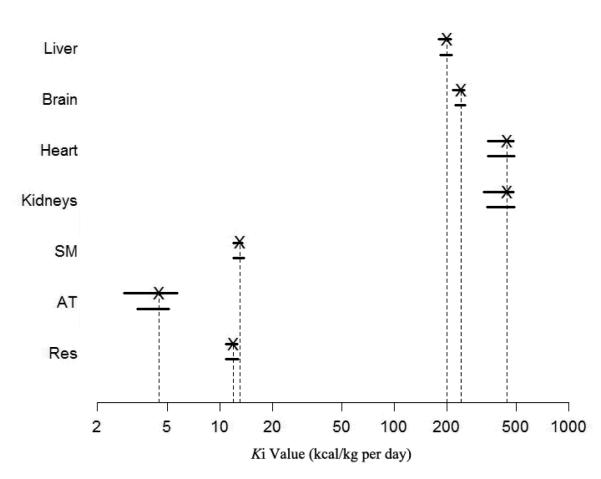
Objectives: The specific resting metabolic rates (K(i) , in kcal/kg per day) of major organs and tissues in the Reference Man were suggested in 1992 by Elia: 200 for liver, 240 for brain, 440 for heart and kidneys, 13 for skeletal muscle, 4.5 for adipose tissue and 12 for the residual mass. However, it is unknown whether gender influences the K(i) values. The aim of the present study was to compare the K(i) values observed in nonelderly nonobese men to the corresponding values in women.
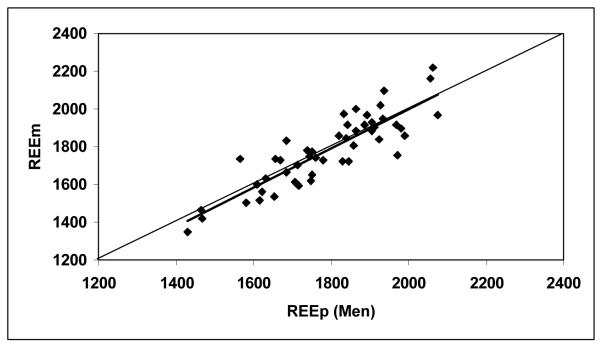
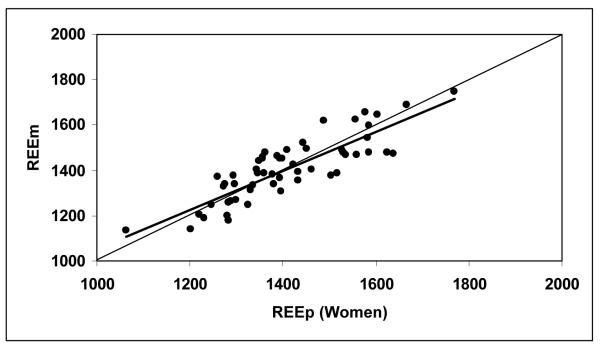
Methods: Elia's K(i) values were evaluated based on a mechanistic model: REE = Σ(K(i) × T(i) ), where REE is whole-body resting energy expenditure measured by indirect calorimetry and T(i) is the mass of major organs and tissues measured by magnetic resonance imaging. Marginal 95% confidence intervals (CIs) for the model-estimated K(i) values were calculated by stepwise univariate regression analysis. Subjects were nonelderly (age 20-49 years) nonobese (BMI 18.5-29.9 kg/m(2) ) men (n = 49) and women (n = 57).
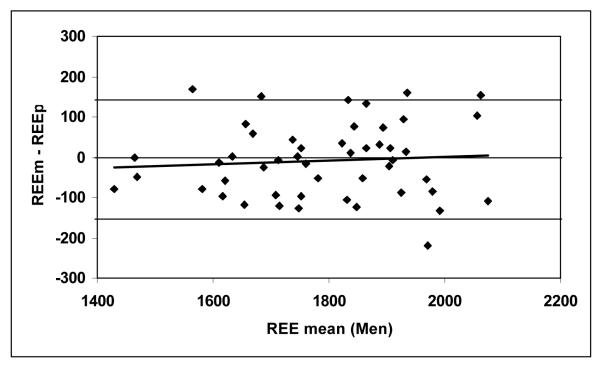
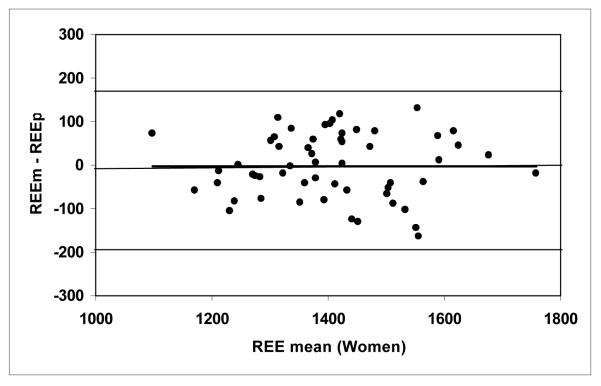
Results: The measured REE (REEm) and the mass of major organs and skeletal muscle were all greater in the men than in women. The predicted REE by Elia's K(i) values were correlated with REEm in men (r = 0.87) and women (r = 0.86, both P < 0.001). Elia's K(i) values were within the range of 95% CIs for both men and women groups, revealing that gender adjustment is not necessary.
Conclusions: Elia's proposed adult K(i) values are valid in both nonelderly nonobese men and women. Further studies are needed to explore the potential influences of age and obesity on K(i) values in humans.
Copyright © 2010 Wiley-Liss, Inc.
Figures
References
-
- Bland JM, Altman DG. Statistical methods for assessing agreement between two methods of clinical measurement. Lancet. 1986;1:307–310. - PubMed
-
- Bosy-Westphal A, Eichhorn C, Kutzner D, Illner K, Heller M, Müller MJ. The age-related decline in resting energy expenditure in humans is due to the loss of fat-free mass and to alterations in its metabolically active components. J Nutr. 2003;133:2356–2362. - PubMed
-
- Bosy-Westphal A, Reinecke U, Schlorke T, Illner K, Kutzner D, Heller M, Müller MJ. Effect of organ and tissue masses on resting energy expenditure in underweight, normal weight and obese adults. Int J Obes. 2004;28:72–79. - PubMed
-
- Elia M. Organ and tissue contribution to metabolic rate. In: Kinney JM, Tucker HN, editors. Energy Metabolism: Tissue Determinants and Cellular Corollaries. Raven Press; New York: 1992. pp. 61–80.
-
- FAO/WHO/UNU . Report of Joint FAO/WHO/UNU Expert Consultation. Rome: 2004. Human Energy Requirements; pp. 35–50.
Publication types
MeSH terms
Grants and funding
LinkOut - more resources
Full Text Sources
