. 2012 Apr;33(4):778-96.
doi: 10.1002/hbm.21249. Epub 2011 Apr 11.

Identifying the default-mode component in spatial IC analyses of patients with disorders of consciousness

Affiliations

Identifying the default-mode component in spatial IC analyses of patients with disorders of consciousness

Andrea Soddu et al. Hum Brain Mapp. 2012 Apr.

Abstract

Objectives: Recent fMRI studies have shown that it is possible to reliably identify the default-mode network (DMN) in the absence of any task, by resting-state connectivity analyses in healthy volunteers. We here aimed to identify the DMN in the challenging patient population of disorders of consciousness encountered following coma.

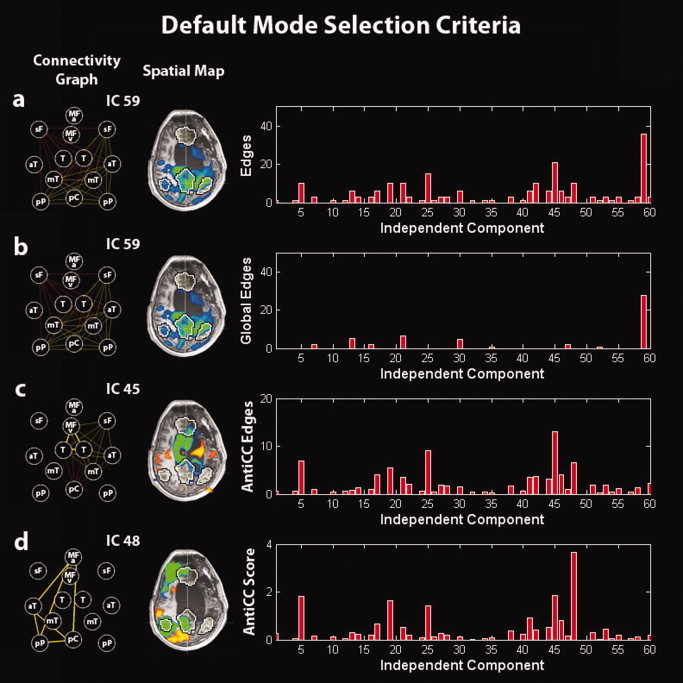
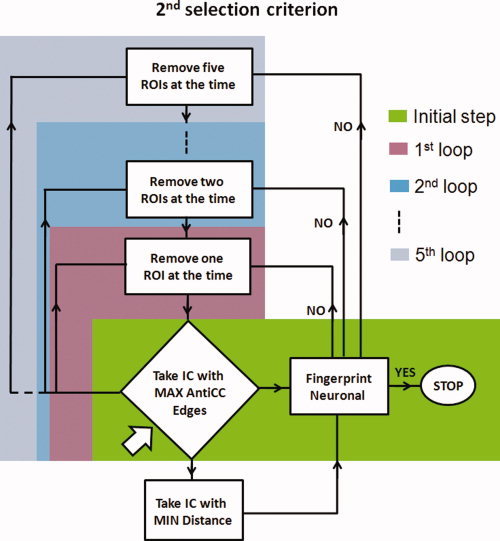
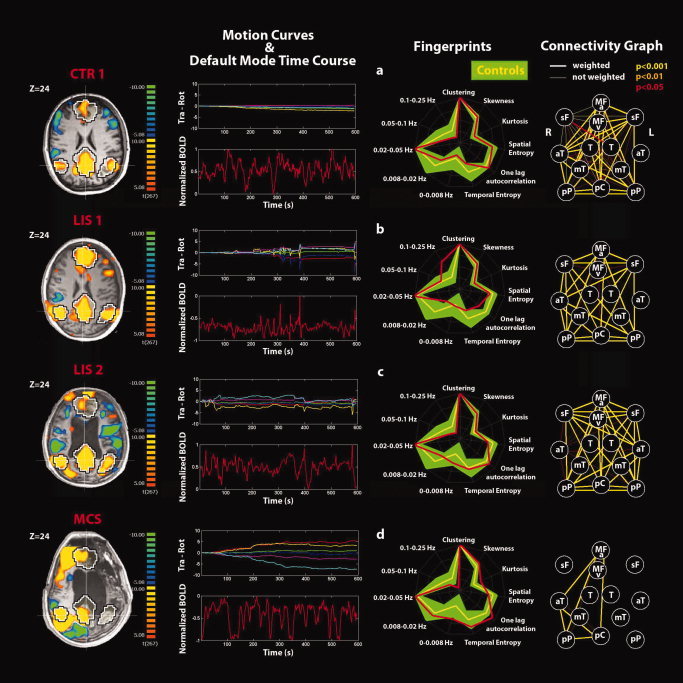
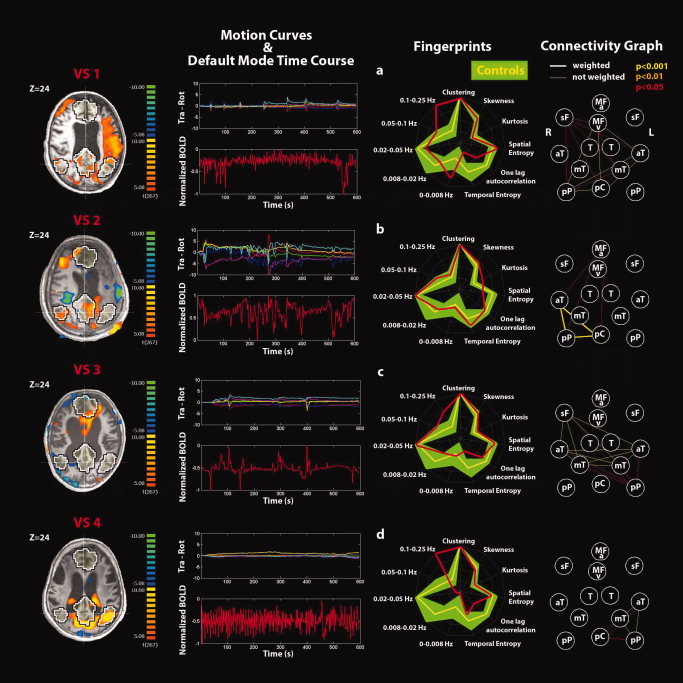
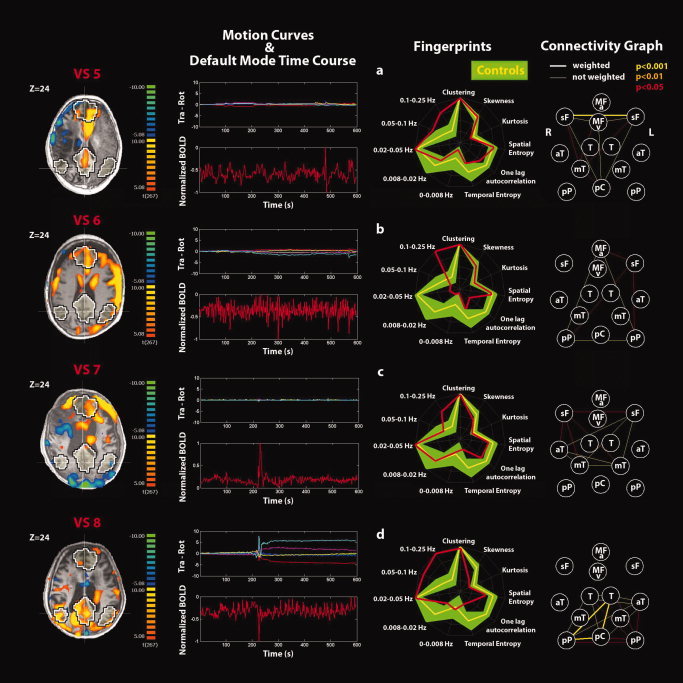
Experimental design: A spatial independent component analysis-based methodology permitted DMN assessment, decomposing connectivity in all its different sources either neuronal or artifactual. Three different selection criteria were introduced assessing anticorrelation-corrected connectivity with or without an automatic masking procedure and calculating connectivity scores encompassing both spatial and temporal properties. These three methods were validated on 10 healthy controls and applied to an independent group of 8 healthy controls and 11 severely brain-damaged patients [locked-in syndrome (n = 2), minimally conscious (n = 1), and vegetative state (n = 8)].

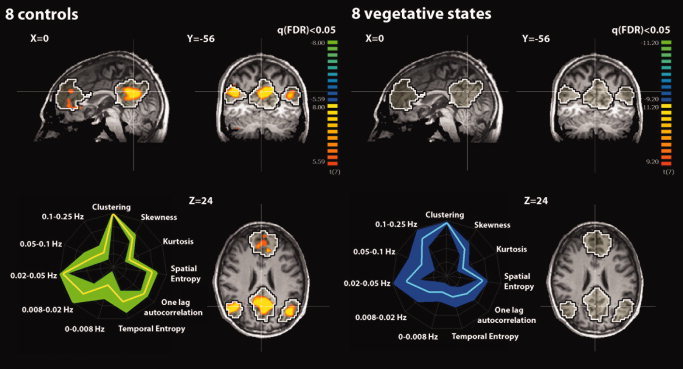
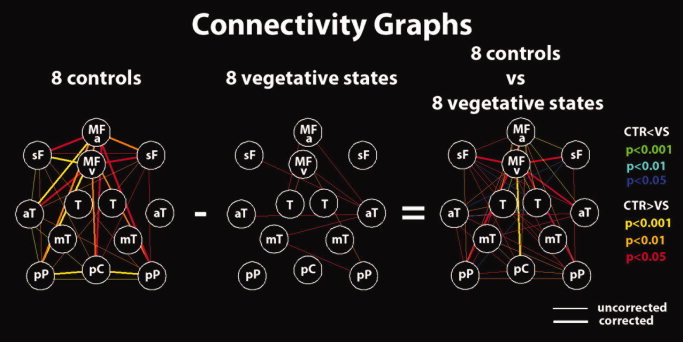
Principal observations: All vegetative patients showed fewer connections in the default-mode areas, when compared with controls, contrary to locked-in patients who showed near-normal connectivity. In the minimally conscious-state patient, only the two selection criteria considering both spatial and temporal properties were able to identify an intact right lateralized BOLD connectivity pattern, and metabolic PET data suggested its neuronal origin.

Conclusions: When assessing resting-state connectivity in patients with disorders of consciousness, it is important to use a methodology excluding non-neuronal contributions caused by head motion, respiration, and heart rate artifacts encountered in all studied patients.


Figures

Figure 1
Figure 1
Illustration of the default‐mode selection method in a minimally conscious‐state patient. (a) Selection of the IC corresponding to the graph with the highest number of edges. (b) Selection of the IC corresponding to the graph with the highest number of global edges (to select the global signal IC). (c) Selection of the IC corresponding to the graph with the highest number of anticorrelation‐corrected edges. (d) Selection of the IC corresponding to the graph with the highest anticorrelation‐corrected score. Right panel: (a) number of edges, (b) number of global edges, (c) number of anticorrelation‐corrected edges, and (d) anticorrelation‐corrected score of each graph vs. the corresponding IC number. Middle panel: Spatial map of the selected IC. Left panel: Connectivity graph of the selected IC. MFv, medial prefrontal cortex ventral; MFa, medial prefrontal cortex anterior; pC, posterior cingulate/precuneus; pP, posterior parietal lobe; sF, superior frontal gyrus; aT, middle temporal gyrus anterior; mT, parahippocampal/mesiotemporal; T, thalamus. Left is right side of brain.
Figure 2
Figure 2
Flow chart illustrating the second selection criterion. Arrow indicates the starting point in the flow chart. Different color boxes indicate the different steps. [Color figure can be viewed in the online issue, which is available at wileyonlinelibrary.com.]
Figure 3
Figure 3
Upper part: Random‐effect group analyses identifying the default‐mode network (DMN) in eight healthy controls and eight patients in a vegetative state (VS). Results are thresholded at false discovery rate corrected P < 0.05 with a mask given by the black and white contour regions showing the DMN from an independent dataset (n = 11 healthy controls, Group 1). Lower part: Graphical representation (i.e., fingerprint; normalized values) of DMN temporal properties (five frequency bands, temporal entropy, and one‐lag autocorrelation) and spatial properties (spatial entropy, skewness, kurtosis, and clustering) in healthy controls [mean (yellow) and SD (green)] and in VS patients [mean (cyan) and SD (blue)]. [Color figure can be viewed in the online issue, which is available at wileyonlinelibrary.com.]
Figure 4
Figure 4
Connectivity graphs for the eight healthy controls and the eight VS patients' groups and between‐group differences. Red (blue), orange (cyan), and yellow (green) lines represent P = 0.05, P = 0.01, and P = 0.001, respectively, for positive and negative differences. Thicker lines are connections surviving correction for multiple comparisons. Nodes are defined as for Figure 1. [Color figure can be viewed in the online issue, which is available at wileyonlinelibrary.com.]
Figure 5
Figure 5
Single‐subject analyses identifying the default‐mode network (DMN) and connectivity graphs in (a) a representative healthy control, (b, c) LIS patients 1, 2, and (d) MCS patient. Positive correlations (yellow) and anticorrelations (blue) with the DM time course shown on a transverse section at Z = 24 mm (thresholded at corrected P < 0.05). Black and white contour regions show the DMN from an independent dataset of 11 healthy controls. Motion curves illustrate translation (in mm) for x (red), y (green), and z (blue) and rotation (in °) for pitch (yellow), roll (purple), and yaw (cyan) parameters, and the DMN time course illustrates the normalized BOLD signal over 600 s. The fingerprint summarizes the DMN temporal and spatial properties for each subject (red) superimposed to the control data of eight healthy subjects (mean in yellow and standard deviation in green). The connectivity graph illustrates the connections between the 13 selected DM nodes at different thresholds for significance (thick lines, “weighted edges” are corrected for external network anticorrelations). Nodes are defined as for Figure 1.
Figure 6
Figure 6
Single‐subject analyses identifying the default‐mode network (DMN) and connectivity graphs in (ad) VS patients 1–4. See Figure 5 for explanatory legend. [Color figure can be viewed in the online issue, which is available at wileyonlinelibrary.com.]
Figure 7
Figure 7
Single‐subject analyses identifying the default‐mode network (DMN) and connectivity graphs in (ad) VS patients 5–8. See Figure 5 for explanatory legend. [Color figure can be viewed in the online issue, which is available at wileyonlinelibrary.com.]

Similar articles

Cited by

References

    1. Alkire MT, Miller J ( 2005): General anesthesia and the neural correlates of consciousness. Prog Brain Res 150: 229–244. - PubMed
    1. American Congress of Rehabilitation Medicine ( 1995): Recommendations for use of uniform nomenclature pertinent to patients with severe alterations in consciousness. Arch Phys Med Rehabil 76: 205–209. - PubMed
    1. Anand A, Li Y, Wang Y, Wu J, Gao S, Bukhari L, Mathews VP, Kalnin A, Lowe MJ ( 2005): Activity and connectivity of brain mood regulating circuit in depression: A functional magnetic resonance study. Biol Psychiatry 57: 1079–1088. - PubMed
    1. Baars BJ, Ramsoy TZ, Laureys S ( 2003): Brain, conscious experience and the observing self. Trends Neurosci 26: 671–675. - PubMed
    1. Beckmann CF, DeLuca M, Devlin JT, Smith SM ( 2005): Investigations into resting‐state connectivity using independent component analysis. Philos Trans R Soc Lond B Biol Sci 360: 1001–1013. - PMC - PubMed