Review
. 2011 Apr;1224(1):22-39.
doi: 10.1111/j.1749-6632.2011.05965.x.

Bayesian models: the structure of the world, uncertainty, behavior, and the brain

Affiliations
Review

Bayesian models: the structure of the world, uncertainty, behavior, and the brain

Iris Vilares et al. Ann N Y Acad Sci. 2011 Apr.

Abstract

Experiments on humans and other animals have shown that uncertainty due to unreliable or incomplete information affects behavior. Recent studies have formalized uncertainty and asked which behaviors would minimize its effect. This formalization results in a wide range of Bayesian models that derive from assumptions about the world, and it often seems unclear how these models relate to one another. In this review, we use the concept of graphical models to analyze differences and commonalities across Bayesian approaches to the modeling of behavioral and neural data. We review behavioral and neural data associated with each type of Bayesian model and explain how these models can be related. We finish with an overview of different theories that propose possible ways in which the brain can represent uncertainty.


Figures

Fig. 1
Fig. 1
Cue combination. A) Example of an indirect observation of a cat’s position. You can see the bush moving and hear a “meow” sound but you cannot directly observe the cat. Cartoon made by Hugo M. Martins. B) Graphical model of what is seen in A. The variable X (position of the cat) is unobserved, but it produces two observed variables: the moving bush, which provides a visual cue (Ov), and the “meow” sound, which provides an auditory cue (OA).
Fig. 2
Fig. 2
Combining a cue with prior knowledge. A) Example of an indirect observation of a cat’s position, but in which only a “meow” can be heard. B) Graphical model of what is seen in A. The variable X (position of the cat) is unobserved, but it produces the observed “meow” sound, which provides an auditory cue (OA). C) Example of a visual illusion. Here people generally see one grove (left) and two bumps, but if the paper is rotated 180° then two groves and one bump are perceived. D) Checker-shadow illusion [54]. In this visual illusion, the rectangle A appears to be darker than B, while in reality they have the same color.
Fig. 3
Fig. 3
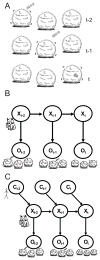
Combining information across time. A) Example of an indirect observation of a cat’s position, at different points of time (t-2, t-1 and t, being t the present time). B) Graphical model of what is seen in A. The hidden variable X (position of the cat) at each point of time produces a variable O that is observed. C) Graphical model similar to B, but in which the external effect of a Controller (in this case, a person) is incorporated in the model, which will affect X.
Fig. 4
Fig. 4
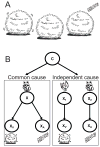
Inferring the causal structure of the world. A) Example of an indirect observation of a cat’s position. In this case the movement of the bush is seen in one direction but the “meow” seems to come from somewhere else. B) Graphical model of what is seen in A. The visual and the auditory cue may have a common cause (left box) or randomly co-occurring, independent causes (right box).
Fig. 5
Fig. 5
Generative models for visual scenes. A) Graphical model of a generative model for visual scenes. In this model, a scene starts empty and is then filled with different concepts: objects (animals; people…), texts (written text) and texture. M, N and K represent the (unknown) number of objects, texts and textures present in the image. B) Example of a visual scene. Highlighted in red is the “object”; in blue the “text” and the rest of the image can be considered “texture”.
Fig. 6
Fig. 6
Possible neural representations of uncertainty. In red are the putative firing rates (or connections) in a low-uncertainty state and in blue the ones occurring in a high-uncertainty state. Panels A trough F represent different theories that have been proposed on how the brain could be representing uncertainty.

References

    1. Marr D. Vision: A Computational Approach. Freeman & Co; San Francisco: 1982.
    1. Kording K. Decision theory: what “should” the nervous system do? Science. 2007;318:606–610. - PubMed
    1. Plato. 360 B.C. Republic.

    1. Smith MA. Alhacen’s Theory of Visual Perception. 2001.
    1. Helmholtz HLF. Thoemmes Continuum. 1856. Treatise on Physiological Optics.

Publication types