. 2011 Apr 12:11:130.
doi: 10.1186/1471-2407-11-130.

Inflammatory mediators in breast cancer: coordinated expression of TNFα & IL-1β with CCL2 & CCL5 and effects on epithelial-to-mesenchymal transition

Affiliations

Inflammatory mediators in breast cancer: coordinated expression of TNFα & IL-1β with CCL2 & CCL5 and effects on epithelial-to-mesenchymal transition

Gali Soria et al. BMC Cancer. .

Abstract

Background: The inflammatory chemokines CCL2 (MCP-1) & CCL5 (RANTES) and the inflammatory cytokines TNFα & IL-1β were shown to contribute to breast cancer development and metastasis. In this study, we wished to determine whether there are associations between these factors along stages of breast cancer progression, and to identify the possible implications of these factors to disease course.

Methods: The expression of CCL2, CCL5, TNFα and IL-1β was determined by immunohistochemistry in patients diagnosed with: (1) Benign breast disorders (=healthy individuals); (2) Ductal Carcinoma In Situ (DCIS); (3) Invasive Ducal Carcinoma without relapse (IDC-no-relapse); (4) IDC-with-relapse. Based on the results obtained, breast tumor cells were stimulated by the inflammatory cytokines, and epithelial-to-mesenchymal transition (EMT) was determined by flow cytometry, confocal analyses and adhesion, migration and invasion experiments.

Results: CCL2, CCL5, TNFα and IL-1β were expressed at very low incidence in normal breast epithelial cells, but their incidence was significantly elevated in tumor cells of the three groups of cancer patients. Significant associations were found between CCL2 & CCL5 and TNFα & IL-1β in the tumor cells in DCIS and IDC-no-relapse patients. In the IDC-with-relapse group, the expression of CCL2 & CCL5 was accompanied by further elevated incidence of TNFα & IL-1β expression. These results suggest progression-related roles for TNFα and IL-1β in breast cancer, as indeed indicated by the following: (1) Tumors of the IDC-with-relapse group had significantly higher persistence of TNFα and IL-1β compared to tumors of DCIS or IDC-no-relapse; (2) Continuous stimulation of the tumor cells by TNFα (and to some extent IL-1β) has led to EMT in the tumor cells; (3) Combined analyses with relevant clinical parameters suggested that IL-1β acts jointly with other pro-malignancy factors to promote disease relapse.

Conclusions: Our findings suggest that the coordinated expression of CCL2 & CCL5 and TNFα & IL-1β may be important for disease course, and that TNFα & IL-1β may promote disease relapse. Further in vitro and in vivo studies are needed for determination of the joint powers of the four factors in breast cancer, as well as analyses of their combined targeting in breast cancer.


Figures
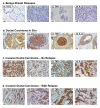
Figure 1
Figure 1
Expression patterns of CCL2, CCL5, TNFα and IL-1β in healthy individuals and breast cancer patients. Representative examples of the expression of CCL2, CCL5, TNFα and IL-1β in the different groups of patients included in the study, in biopsies obtained at the time of diagnosis. (a1-a4) Patients diagnosed with benign breast disorders. The pictures demonstrate the lack of staining of the four factors in the normal breast epithelial cells, as denoted in the majority of patients included in this group. (b1-b4) DCIS patients. The pictures demonstrate positive staining of the four factors in the malignant lesions, as denoted in the majority of patients included in this group. (c1-c4) IDC-no-relapse patients. The pictures demonstrate positive staining of the four factors in the tumor cells, as denoted in the majority of patients included in this group. (d1-d4) IDC-with-relapse patients. The pictures demonstrate positive staining of the four factors in the tumor cells, as denoted in the majority of patients included in this group. (a1, b1, c1, d1) CCL2 staining; (a2, b2, c2, d2) CCL5 staining; (a3, b3, c3, d3) TNFα staining; (a4, b4, c4, d4) IL-1β staining. The expression of the proteins was determined by IHC using specific antibodies, whose specificity in IHC was verified. The values of photo magnification are indicated in the left bottom corner of each of the pictures.
Figure 2
Figure 2
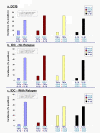
Incidence of expression of CCL2, CCL5, TNFα and IL-1β in healthy individuals and breast cancer patients. The expression of CCL2, CCL5, TNFα and IL-1β was determined by IHC in four groups of patients, in biopsies obtained at the time of diagnosis: Benign (n = 38), DCIS (n = 30), IDC-no-relapse (n = 23) and IDC-with-relapse (n = 35). The incidences of expression of the four factors are diagrammed according to the type of factor analyzed. The number of patients positive for protein expression is indicated above the relevant bar, and the incidence is presented in percentages. ***p < 0.001 for the differences between the incidences of expression of each factor in the tumor cells of DCIS/IDC-no-relapse/IDC-with-relapse, and the incidence of its expression in the normal cells of the Benign group. No significant differences were denoted with respect to CCL2 and CCL5 expression in the tumor cells between the DCIS, IDC-no-relapse and IDC-with-relapse groups. For TNFα and IL-1β expression in the tumor cells, significant elevations were denoted only for the incidence of expression between the DCIS and the IDC-with-relapse groups (TNFα: p = 0.005; IL-1β: p = 0.017).
Figure 3
Figure 3
The associations between the inflammatory chemokines CCL2 & CCL5 and the inflammatory cytokines TNFα & IL-1β, in breast cancer patients. The analyzed factors were sub-divided to two groups: Group 1 - The inflammatory cytokines TNFα & IL-1β; Group 2 - The inflammatory chemokines CCL2 & CCL5; Detailed explanation of graphs A, B and C is provided further below. (a) In DCIS patients, p = 0.002 for associations between Group 1 and Group 2. (b) In IDC-no-relapse patients, p = 0.036 for associations between Group 1 and Group 2. (c) In IDC-with-relapse patients, p = 0.627 for associations between Group 1 and Group 2. Explanation: In each group of breast cancer patients (DCIS, IDC-no-relapse, IDC-with-relapse), the graphs show the following: (1) CCL2: The graph shows the incidence of CCL2 expression when it was co-expressed with TNFα and IL-1β in the same biopsy [presented in the graph as "CCL2 (+ TNFα) (+ IL-1β)"], as compared to the incidence of CCL2 expression when it was NOT co-expressed with TNFα and IL-1β in the same biopsy [presented in the graph as "CCL2 (- TNFα) (- IL-1β)"]; (2) CCL5: The graph shows the incidence of CCL5 expression when it was co-expressed with TNFα and IL-1β in the same biopsy [presented in the graph as "CCL5 (+ TNFα) (+ IL-1β)"], as compared to the incidence of CCL5 expression when it was NOT co-expressed with TNFα and IL-1β in the same biopsy [presented in the graph as "CCL5 (- TNFα) (- IL-1β)"]; (3) TNFα: The graph shows the incidence of TNFα expression when it was co-expressed with CCL2 and CCL5 in the same biopsy [presented in the graph as "TNFα (+ CCL2) (+ CCL5)"], as compared to the incidence of TNFα expression when it was NOT co-expressed with CCL2 and CCL5 in the same biopsy [presented in the graph as "TNFα (- CCL2) (- CCL5)"]; (4) IL-1β: The graph shows the incidence of IL-1β expression when it was co-expressed with CCL2 and CCL5 in the same biopsy [presented in the graph as "IL-1β (+ CCL2) (+ CCL5)"], as compared to the incidence of IL-1β expression when it was NOT co-expressed with CCL2 and CCL5 in the same biopsy [presented in the graph as "IL-1β (- CCL2) (- CCL5)"];
Figure 4
Figure 4
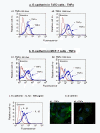
Following stimulation by the inflammatory cytokines (mainly TNFα), the tumor cells show typical characteristics of EMT. The T47D and MCF-7 human breast carcinoma cells were stimulated by TNFα and IL-1β for 72 hr. Note: The cytokine concentrations were chosen based on analyses in which their effects on the tumor cells were tested in a dose-dependent manner (data not shown). (a) Stimulation of T47D cells with 300 U/ml TNFα (a1) or with 1000 U/ml TNFα (a2). The membranous expression of E-cadherin was determined in live cells by flow cytometry. The figure presents the results of a representative experiment of n = 3, all showing similar results. (b) Stimulation of MCF-7 cells with 300 U/ml TNFα (b1) or 1000 U/ml TNFα (b2). The membranous expression of E-cadherin was determined in live cells by flow cytometry. The figure presents the results of a representative experiment of n > 3, all showing similar results. (c) T47D human breast carcinoma cells were stimulated by IL-1β (500 pg/ml). The membranous expression of E-cadherin was determined in live cells by flow cytometry. The figure presents the results of a representative experiment of n = 3, all showing similar results. (d) MCF-7 cells were stimulated by 1000 U/ml TNFα, and β-catenin expression (green) was determined by confocal analyses, in fixed cells. Nuclei are shown by blue DAPI staining. The figure presents the results of a representative experiment of n = 3, all showing similar results.
Figure 5
Figure 5
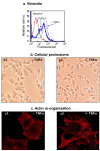
Following stimulation by TNFα, breast tumor cells acquire a mesenchymal phenotype which is accompanied by protrusive characteristics. MCF-7 breast carcinoma cells were stimulated by TNFα (1000 U/ml) for 72 hr. Thereafter, the following analyses were performed: (a) Vimentin expression, determined by specific antibodies in methanol-treated cells and analyzed by flow cytometry. The figure presents the results of a representative experiment of n = 3, all showing similar results. (b) Formation of cellular protrusions, determined by light microscopy. The figure presents the results of a representative experiment of n > 3, all showing similar results. (c) Actin polymerization, determined by phalloidin staining, analyzed by confocal microscopy. The figure presents the results of a representative experiment of n = 3, all showing similar results.
Figure 6
Figure 6
Following stimulation by TNFα, breast tumor cells acquire increased adhesive, migratory and invasive properties. MCF-7 breast carcinoma cells were stimulated by TNFα (1000 U/ml). Thereafter, the following analyses were performed: (a) Following 72 hr stimulation by TNFα, adhesion to substrate was determined by alkaline phosphatase assay. **p = 0.005 for the difference between cells that were stimulated or not stimulated by TNFα. (b, c) Determination of the ability of the cells to perform migratory and invasive activities, in response to serum. Following 48 hr stimulation by TNFα (1000 U/ml), migration and invasion assays were performed in transwells for 21-23 hr with or without TNFα stimulation. (b) Migration. ***p < 0.001 for TNFα-stimulated cells vs. non-stimulated cells. (c1) Invasion counts. ***p < 0.001 for TNFα-stimulated cells vs. non-stimulated cells. (c2) Invasion as demonstrated in light microscopy. HPF = High Power Field. In all parts of the figure, experiments are representatives of n = 3.
Figure 7
Figure 7
In order to induce EMT, TNFα needs to be constantly present in vicinity to the tumor cells. Determination of the reversibility of the TNFα-induced EMT effects. (a) MCF-7 cells were stimulated by TNFα (1000 U/ml) for 72 hr, followed by determination of membranous expression of E-cadherin in live cells, using flow cytometry. (b) The non-stimulated cells of part (A) were grown for additional 72 hr without TNFα. In contrast, the previously-stimulated cells (by TNFα) were grown for additional 72 hr without (b1) or with (b2) TNFα (1000 U/ml). Thereafter, the membranous expression of E-cadherin was determined in live cells by flow cytometry. The experiment is a representative of n = 3.
Figure 8
Figure 8
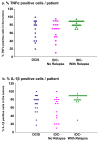
There is high persistence of TNFα and IL-1β in tumors of IDC-with-relapse patients. (a) Analyses of % cells that were positive for TNFα in tumors of breast cancer patients. The figure shows analyses that were performed only in patients whose tumors were positive for TNFα expression: DCIS (n = 15); IDC-no-relapse (n = 17); IDC-with-relapse (n = 29). Each symbol in the graph represents a single patient. Statistical values, as well as X ± SD are provided in Table 3. (b) Analyses of % cells that were positive for IL-1β in tumors of breast cancer patients. The figure shows analyses that were performed only in patients whose tumors were positive for IL-1β expression: DCIS (n = 18); IDC-no-relapse (n = 15); IDC-with-relapse (n = 31). Each symbol in the graph represents a single patient. Statistical values, as well as X ± SD are provided in Table 3.

References

    1. Lewis CE, Hughes R. Inflammation and breast cancer. Microenvironmental factors regulating macrophage function in breast tumours: hypoxia and angiopoietin-2. Breast Cancer Res. 2007;9(3):209. doi: 10.1186/bcr1679. - DOI - PMC - PubMed
    1. Lin EY, Pollard JW. Tumor-associated macrophages press the angiogenic switch in breast cancer. Cancer Res. 2007;67(11):5064–5066. doi: 10.1158/0008-5472.CAN-07-0912. - DOI - PubMed
    1. Soria G, Ben-Baruch A. The inflammatory chemokines CCL2 and CCL5 in breast cancer. Cancer Lett. 2008;267(2):271–285. doi: 10.1016/j.canlet.2008.03.018. - DOI - PubMed
    1. Goldberg JE, Schwertfeger KL. Proinflammatory cytokines in breast cancer: mechanisms of action and potential targets for therapeutics. Curr Drug Targets. 2010;11(9):1133–1146. doi: 10.2174/138945010792006799. - DOI - PubMed
    1. Ben-Baruch A. The multifaceted roles of chemokines in malignancy. Cancer Metastasis Rev. 2006;25(3):357–371. doi: 10.1007/s10555-006-9003-5. - DOI - PubMed

Publication types

MeSH terms