

Increasing malaria hospital admissions in Uganda between 1999 and 2009
- PMID: 21486498
- PMCID: PMC3096581
- DOI: 10.1186/1741-7015-9-37
Increasing malaria hospital admissions in Uganda between 1999 and 2009
Abstract
Background: Some areas of Africa are witnessing a malaria transition, in part due to escalated international donor support and intervention coverage. Areas where declining malaria rates have been observed are largely characterized by relatively low baseline transmission intensity and rapid scaling of interventions. Less well described are changing patterns of malaria burden in areas of high parasite transmission and slower increases in control and treatment access.
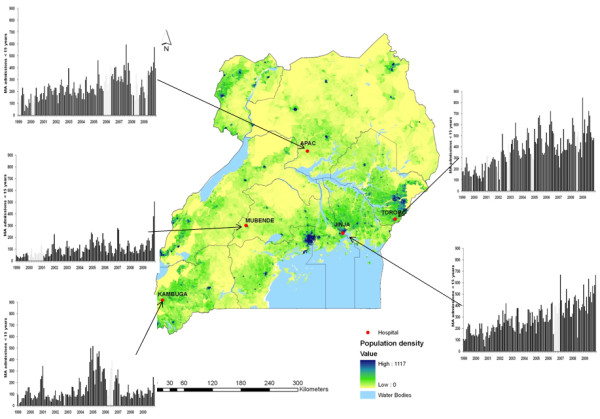
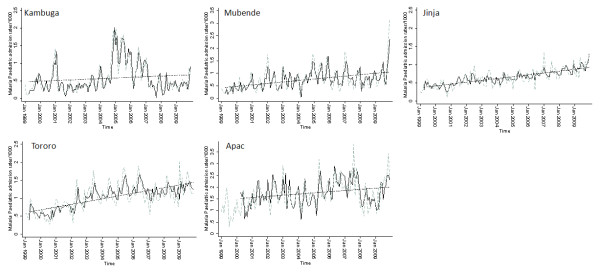
Methods: Uganda is a country predominantly characterized by intense, perennial malaria transmission. Monthly pediatric admission data from five Ugandan hospitals and their catchments have been assembled retrospectively across 11 years from January 1999 to December 2009. Malaria admission rates adjusted for changes in population density within defined catchment areas were computed across three time periods that correspond to periods where intervention coverage data exist and different treatment and prevention policies were operational. Time series models were developed adjusting for variations in rainfall and hospital use to examine changes in malaria hospitalization over 132 months. The temporal changes in factors that might explain changes in disease incidence were qualitatively examined sequentially for each hospital setting and compared between hospital settings
Results: In four out of five sites there was a significant increase in malaria admission rates. Results from time series models indicate a significant month-to-month increase in the mean malaria admission rates at four hospitals (trend P < 0.001). At all hospitals malaria admissions had increased from 1999 by 47% to 350%. Observed changes in intervention coverage within the catchments of each hospital showed a change in insecticide-treated net coverage from <1% in 2000 to 33% by 2009 but accompanied by increases in access to nationally recommended drugs at only two of the five hospital areas studied.
Conclusions: The declining malaria disease burden in some parts of Africa is not a universal phenomena across the continent. Despite moderate increases in the coverage of measures to reduce infection and disease without significant coincidental increasing access to effective medicines to treat disease may not lead to severe disease burden reductions in high transmission areas of Africa. More data is needed from a wider range of malaria settings to provide an honest tracking progress of the impact of scaled intervention coverage in Africa.
Figures
References
-
- Barnes KI, Durrheim DN, Little F, Jackson A, Mehta U, Allen E, Dlamini SS, Tsoka J, Bredenkamp B, Mthembu DJ, White NJ, Sharp BL. Effect of artemether-lumefantrine policy and improved vector control on malaria burden in KwaZulu-Natal, South Africa. PLoS Med. 2005;2:e330. doi: 10.1371/journal.pmed.0020330. - DOI - PMC - PubMed
-
- Bhattarai A, Ali AS, Kachur SP, Martensson A, Abbas AK, Khatib R, Al-Mafazy AW, Ramsan M, Rotllant G, Gerstenmaier JF, Molteni F, Abdulla S, Montgomery SM, Kaneko A, Bjorkman A. Impact of artemisinin-based combination therapy and insecticide-treated nets on malaria burden in Zanzibar. PLoS Med. 2007;4:e309. doi: 10.1371/journal.pmed.0040309. - DOI - PMC - PubMed
-
- Ceesay SJ, Casals-Pascual C, Erskine J, Anya SE, Duah NO, Fulford AJ, Sesay SS, Abubakar I, Dunyo S, Sey O, Palmer A, Fofana M, Corrah T, Bojang KA, Whittle HC, Greenwood BM, Conway DJ. Changes in malaria indices between 1999 and 2007 in The Gambia: a retrospective analysis. Lancet. 2008;372:1545–1554. doi: 10.1016/S0140-6736(08)61654-2. - DOI - PMC - PubMed
-
- Ceesay SJ, Casals-Pascual C, Nwakanma DC, Walther M, Gomez-Escobar N, Fulford AJ, Takem EN, Nogaro S, Bojang KA, Corrah T, Jaye MC, Taal MA, Sonko AA, Conway DJ. Continued decline of malaria in The Gambia with implications for elimination. PLoS ONE. 2010;5:e12242. doi: 10.1371/journal.pone.0012242. - DOI - PMC - PubMed
Publication types
MeSH terms
Grants and funding
LinkOut - more resources
Full Text Sources
Medical
