. 2011 Aug;37(1):28-38.
doi: 10.1016/j.jaut.2011.03.001. Epub 2011 Apr 12.

Human NKT cells direct the differentiation of myeloid APCs that regulate T cell responses via expression of programmed cell death ligands

Affiliations

Human NKT cells direct the differentiation of myeloid APCs that regulate T cell responses via expression of programmed cell death ligands

Subramanya Hegde et al. J Autoimmun. 2011 Aug.

Abstract

NKT cells are innate lymphocytes that can recognize self or foreign lipids presented by CD1d molecules. NKT cells have been shown to inhibit the development of autoimmunity in murine model systems, however, the pathways by which they foster immune tolerance remain poorly understood. Here we show that autoreactive human NKT cells stimulate monocytes to differentiate into myeloid APCs that have a regulatory phenotype characterized by poor conjugate formation with T cells. The NKT cell instructed myeloid APCs show elevated expression of the inhibitory ligand PD-L2, and blocking PD-L1 and PD-L2 during interactions of the APCs with T cells results in improved cluster formation and significantly increased T cell proliferative responses. The elevated expression of PD-L molecules on NKT-instructed APCs appears to result from exposure to extracellular ATP that is produced during NKT-monocyte interactions, and blocking purinergic signaling during monocyte differentiation results in APCs that form clusters with T cells and stimulate their proliferation. Finally, we show that human monocytes and NKT cells that are injected into immunodeficient mice co-localize together in spleen and liver, and after 3 days in vivo in the presence of NKT cells a fraction of the myeloid cells have upregulated markers associated with differentiation into professional APCs. These results suggest that autoreactive human NKT cells may promote tolerance by inducing the differentiation of regulatory myeloid APCs that limit T cell proliferation through expression of PD-L molecules.


Figures

Figure 1
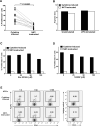
Figure 1. Regulatory phenotype of NKT-instructed APCs
A) NKT-instructed APCs limit the proliferation of allogeneic T cells. Purified peripheral blood T cells were labeled with CFSE and cultured for 7 days with allogeneic NKT-instructed or cytokine-induced APCs. The plot shows percentages of live T cells that underwent cell division as estimated by dilution of CFSE signal; each pair of symbols represents an independent analysis of an allogeneic T cell-APC mixture. B) Cytokine-induced and NKT-instructed APCs produce similar levels of arginase. APCs were stimulated with LPS for 24 hours or left unstimulated, and the culture supernatants were assessed for arginase activity using a chromogenic assay that detects urea generated by the presence of enzyme (QuantiChrom, Bioassay Systems Inc.). C and D) APCs were matured with LPS for 8 hours, washed and cultured with allogenic T cells in the presence of the indicated concentrations of either the arginase inhibitor Nor-NOHA (B), or the iNOS inhibitor 1400W (C), for 7 days. Proliferation is shown as the percent of the live T cells (DAPI-/CD3+) that showed reduced CFSE intensity. Results shown are from one representative experiment out of 2 independent analyses. E) NKT-instructed APCs do not induce increased numbers of regulatory T cells. Flow cytometric analysis of intracellular FoxP3 expression by allogeneic T cells after 7 days of culture with cytokine-induced or NKT-instructed APCs. Similar results were obtained in 3 independent experiments.
Figure 2
Figure 2. NKT-instructed APCs are refractory to conjugation with T cells
A) NKT-instructed APCs show an early defect in activation of allogeneic T cells. T cells were exposed to NKT-instructed or cytokine-induced APCs, and assayed for cell surface CD69 expression by flow cytometry at the indicated times. B) T cells and APCs were labeled with fluorescent dyes then centrifuged to initiate contact. After the indicated incubation times, the cells were vortexed vigorously to dissociate loosely adhered aggregates, and analyzed by flow cytometery to identify the percentage of the total T cells that were conjugated to APCs. C) Allogeneic T cells become incorporated into multi-cell clusters with cytokine-induced APCs, but not with NKT-instructed APCs. T cells were labeled with CSFE (shown in green) and APCs with DiD (shown in red). After 24 hours of co-culture at a 1:1 ratio, APC and T cell clustering was visualized using a fluorescent microscope at 20x magnification; scale bars in the lower left corners of the phase contrast plots represent approximately 100 microns. Results shown in parts B-D are each representative of at least 3 independently performed experiments.
Figure 3
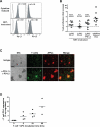
Figure 3. Role of inhibitory B7 family proteins in the regulatory phenotype of NKT-instructed APCs
A) Expression of PD-L1 and PD-L2 by NKT-instructed APCs. APCs were stimulated with LPS for 8 hours and stained for surface PD-L1 and PD-L2 (solid histograms) or with isotype-matched negative control antibodies (open histograms). The result shown is one representative experiment out of 6 independent analyses. B) Blocking PD-L molecules promotes T cell proliferation in response to NKT-instructed APCs. The plot shows the fold increase in allogeneic T cell proliferation in response to NKT-instructed APCs in the presence of blocking antibodies against PD-L1 and/or PD-L2 compared to an isotype-matched control antibody. Each symbol represents the results from an independent analysis. C) Analysis of the effects of blocking PD-L molecules on the ability of allogeneic T cells to form multi-cellular clusters with NKT-instructed APCs. APCs (red) were cultured for 24 hours with T cells (green) in the presence of neutralizing antibodies against PD-L1 and PD-L2 (lower panels) or with matched isotype control antibodies (upper panels). Similar results were obtained in 3 independent experiments. D) Allogeneic T cells cultured with NKT-instructed APCs show upregulation of cell surface PD-1. The plot shows the percentage of T cells having up-regulated cell surface PD-1 after the indicated culture times in the presence of NKT-instructed APCs. Each point shows results from one independent analysis.
Figure 4
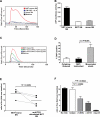
Figure 4. Extracellular ATP released during the interaction of NKT cells with monocytes stimulates monocyte calcium flux
A) Supernatant from a brief co-culture of monocytes with NKT cells induces strong intracellular calcium flux in fresh monocytes. The plot shows flow cytometric analysis of intracellular calcium flux, as assessed by a change in the fluorescence ratio of the indicator dyes Fluo-4 and Fura-red, in freshly isolated human monocytes exposed to culture supernatant from NKT cells and monocytes (red line), or culture medium containing GMCSF and IL-4 (blue line), or medium alone (black line). B) Supernatants of NKT cells co-cultured with monocytes (black bar), or NKT cells cultured alone (white bar), or culture medium with no cells (grey bar) were analyzed for the presence of extracellular ATP using a luminescent kinase assay. The plot shows the means and standard deviations from 2 replicates. Similar results were obtained in 4 independent experiments. C) Supernatants from a co-culture of NKT cells and monocytes were treated for 10 minutes with the indicated concentrations of apyrase enzyme, then used to stimulate calcium flux in freshly isolated monocytes. D) Monocytes were tested for viability after culture alone (grey bar), in the presence of factors produced by NKT cells (black bar), or in the presence of GM-CSF and IL-4 (white bar). The plot shows the percentage of the monocytes that stained positively for DAPI, an indicator of loss of viability. The results show the means and standard deviations from 3 independent analyses. E) Supernatants from NKT cells cultured with monocytes or on plates coated with anti-CD3 antibody were tested for the ability to induce calcium flux in freshly isolated monocytes. The plot shows the fold increase in fluxing monocytes for each type of supernatant, as calculated by dividing the percent of cells in flux at the maximum part of the peak by the percent in flux at the baseline, for four independent analyses. Paired samples are connected by dashed grey lines. F) Monocytes and NKT cells were co-cultured in medium alone (no mAb), or in the presence of blocking antibodies against CD1d, or CD40L, or with an isotype-matched negative control antibody (isotype). Supernatants collected after 8 hours were tested for the ability to induce calcium flux in freshly isolated monocytes compared to medium alone (neg ctrl). The plot shows the means and standard deviations from 4 independent experiments.
Figure 5
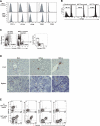
Figure 5. Blocking purinergic signaling during monocyte differentiation prevents the induction of the suppressive phenotype in NKT-instructed APCs
A) NKT-instructed APCs were generated in the presence or absence of suramin during the monocyte differentiation step, then washed and stimulated with LPS for 8 hours and stained for expression of PD-L1 and PD-L2 (filled histograms) or with isotype-matched negative control antibodies (open histograms). The data shown are from one representative experiment out of 6 independent analyses. B) NKT-instructed APCs that were generated as described in part (A) form multi-cellular clusters with allogeneic T cells. The results shown are from one representative experiment out of 3 independent analyses. C) NKT-instructed APCs generated as described in part (A) showed an increased ability to stimulate proliferation by allogeneic T cells compared to NKT-instructed APCs generated in the absence of suramin. D) Freshly isolated monocytes were cultured with 300 U/ml GM-CSF and 2 U/ml IL-13, in the presence or absence of 100 ng/ml IL-6 and 100 μM ATP as indicated. APCs were stimulated with LPS for 8 hours and stained for surface PD-L1 and PD-L2 (solid histograms) or with isotype-matched negative control antibodies (open histograms). Results shown are from one representative experiment out of 4 independent analyses.
Figure 6
Figure 6. Human NKT cells induce the differentiation of monocytes in vivo
A) Flow cytomentric analysis of APCs generated through exposure to soluble factors produced by NKT cells and monocytes (NKT trans-well, bottom row) compared to those generated by three days of direct co-culture with NKT cells (NKT contact, top row). B) Contact with NKT cells does not prevent the induction of the suppressive phenotype of NKT-instructed APCs. APCs were generated using a trans-well system that allowed exposure only to secreted factors from NKT cells and monocytes, or by direct co-culture with NKT cells followed by removal of the NKT cells by magnetic sorting, or by culturing with recombinant GM-CSF and IL-4 (cytokine induced). The plots show flow cytometric staining for CFSE of allogeneic T cells cultured with the indicated APCs for 7 days. Similar results were obtained in 2 further independent experiments. C) Detection of human monocytes and NKT cells after transfer into immunodeficient mice. The plots show flow cytometric analysis of spleen cells from a mouse that was not injected with human cells compared to a mouse that had been intraperitoneally injected with purified human monocytes and NKT cells 24 hours earlier. D) Immunohistochemical analysis showing localization of human cells in spleen and liver of immunodeficient mice. Mice were injected as in (C), and spleen and liver were harvested after 3, 24 or 60 hours post-injection, and tissue sections were stained with an antibody against human CD45 (dark brown colored cells). Cell nuclei are visualized by counterstaining with hematoxylin (blue coloration). All images represent 40X magnification. E) Induction of monocyte differentiation in vivo. Freshly isolated human peripheral blood monocytes were injected into immunodeficient mice in the presence of autologous human peripheral blood T cells alone, or autologous human peripheral blood T cells and human NKT cells. The contour plots show staining of the indicated markers on cells that were positive for human CD45 and negative for human CD3. Similar results were obtained in 10 independent analyses.

Similar articles

Cited by

References

    1. Exley M, Garcia J, Wilson SB, Spada F, Gerdes D, Tahir SMA, Patton KT, Blumberg RS, Porcelli S, Chott A, et al. CD1d structure and regulation on human thymocytes, peripheral blood T cells, B cells and monocytes. Immunology. 2000;100:37–47. - PMC - PubMed
    1. Spada FM, Borriello F, Sugita M, Watts GF, Koezuka Y, Porcelli SA. Low expression level but potent antigen presenting function of CD1d on monocyte lineage cells. Eur. J. Immunol. 2000;30:3468–77. - PubMed
    1. Kawano T, Cui J, Koezuka Y, Toura I, Kaneko Y, Motoki K, Ueno H, Nakagawa R, Sato H, Kondo E, et al. CD1d-restricted and TCR-mediated activation of valpha14 NKT cells by glycosylceramides. Science. 1997;278:1626–9. - PubMed
    1. Kinjo Y, Tupin E, Wu D, Fujio M, Garcia-Navarro R, Benhnia MR, Zajonc DM, Ben-Menachem G, Ainge GD, Painter GF, et al. Natural killer T cells recognize diacylglycerol antigens from pathogenic bacteria. Nat Immunol. 2006;7:978–86. - PubMed
    1. Kinjo Y, Wu D, Kim G, Xing GW, Poles MA, Ho DD, Tsuji M, Kawahara K, Wong CH, Kronenberg M. Recognition of bacterial glycosphingolipids by natural killer T cells. Nature. 2005;434:520–5. - PubMed

Publication types

MeSH terms