. 2011 Apr 15;589(Pt 8):1991-2006.
doi: 10.1113/jphysiol.2010.198945. Epub 2011 Feb 28.

Excitatory-inhibitory imbalance in hypoglossal neurons during the critical period of postnatal development in the rat

Affiliations

Excitatory-inhibitory imbalance in hypoglossal neurons during the critical period of postnatal development in the rat

Xiu-ping Gao et al. J Physiol. .

Abstract

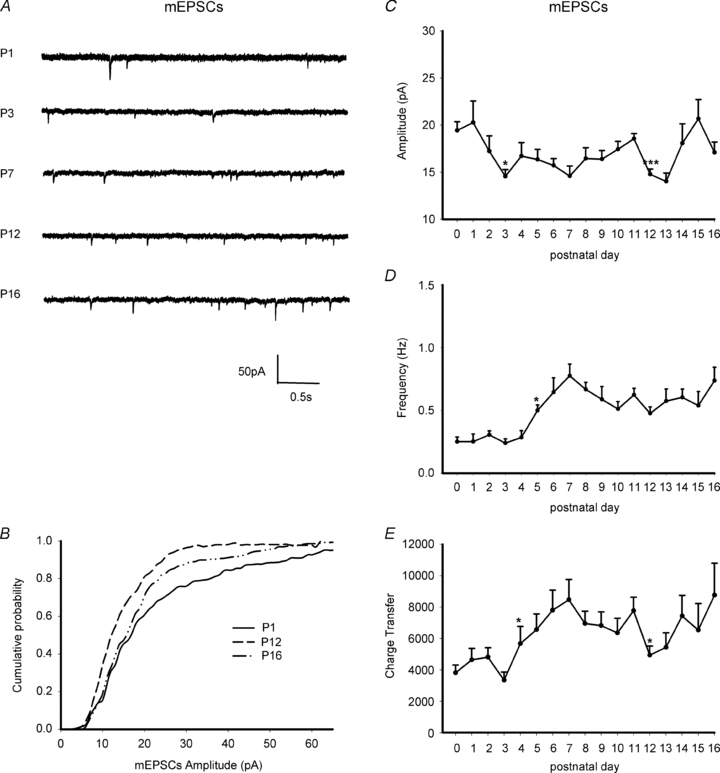
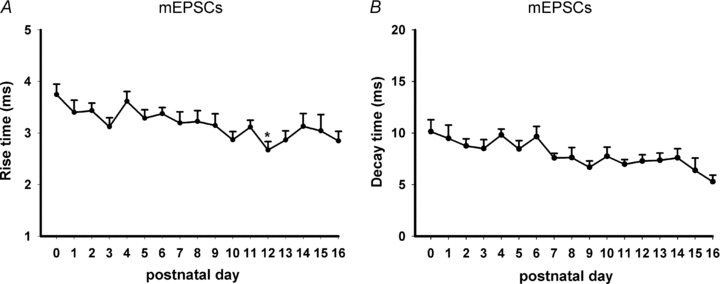
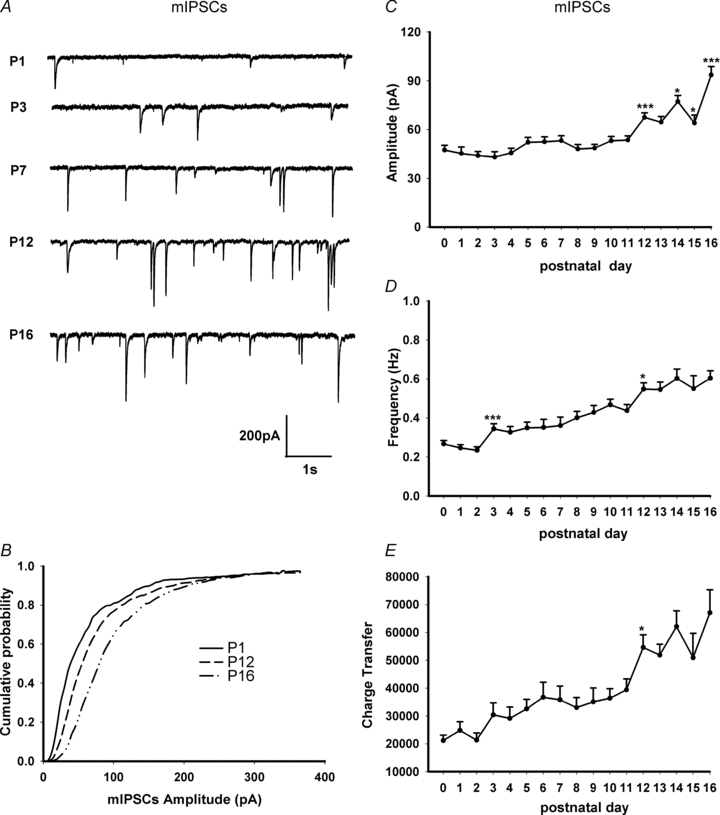
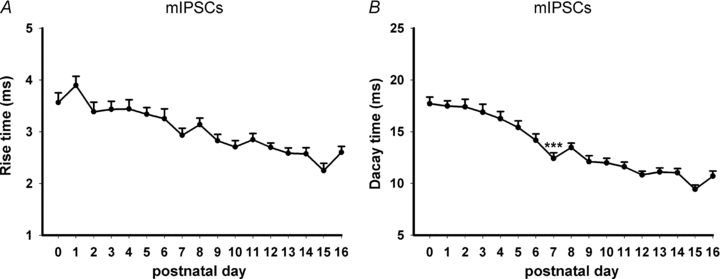
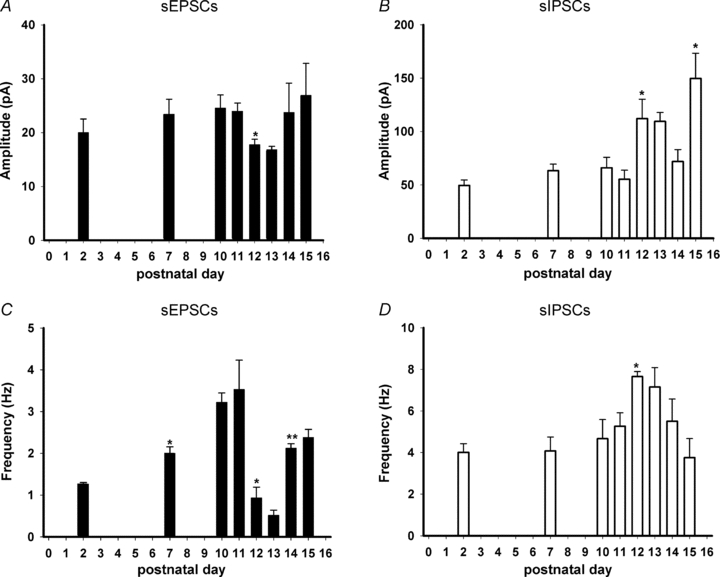
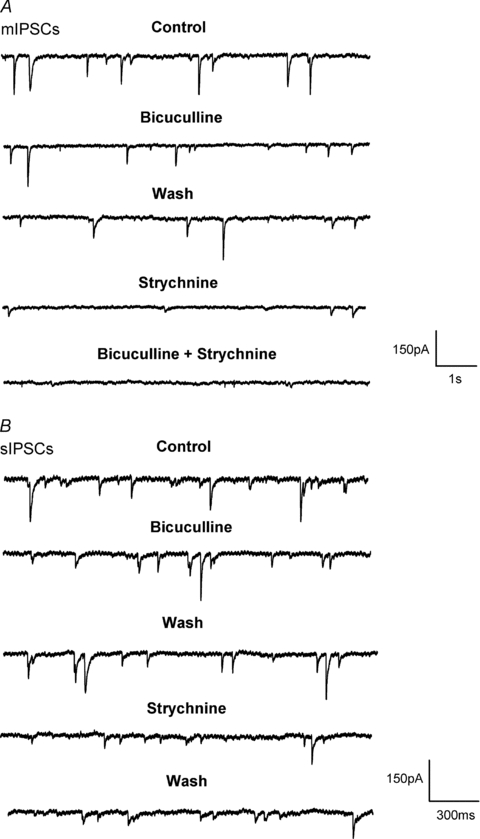
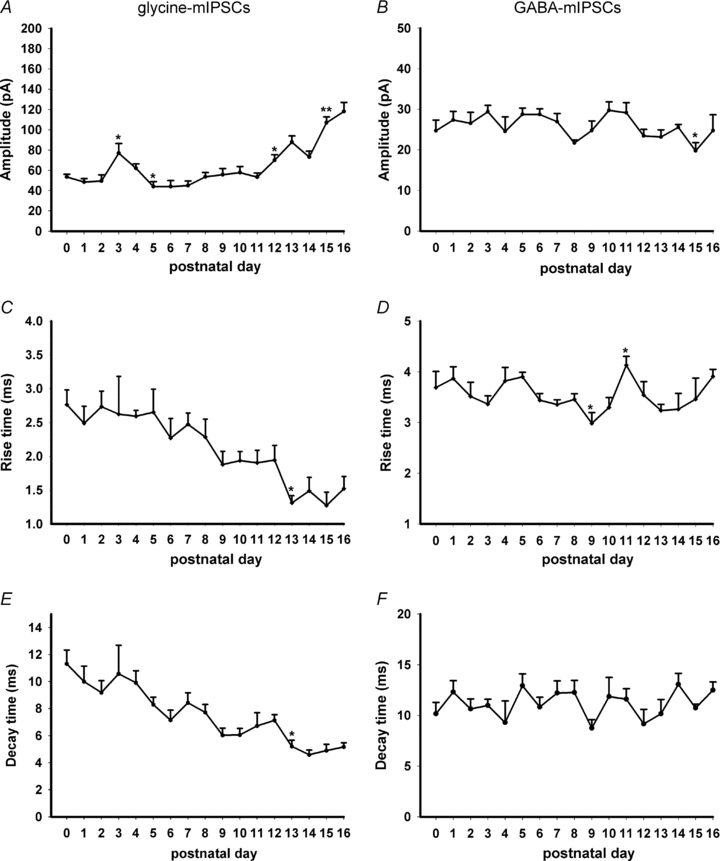
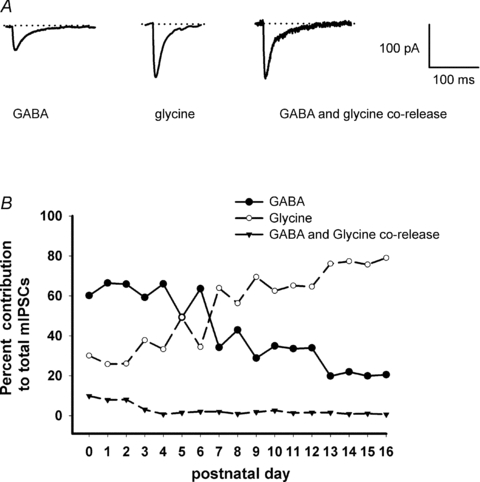
Hypoglossal motoneurons (HMs) innervate tongue muscles and are critical in maintaining patency of the upper airway during respiration. Abnormalities in HMs have been implicated in sudden infant death syndrome (SIDS) and obstructive sleep apnoea. Previously, we found a critical period in respiratory network development in rats around postnatal day (P) 12-13, when abrupt neurochemical, metabolic and physiological changes occurred. To test our hypothesis that an imbalance between inhibitory and excitatory synaptic transmission exists during the critical period, whole-cell patch-clamp recordings of HMs were done in brainstem slices of rats daily from P0 to P16. The results indicated that: (1) the amplitude and charge transfer of miniature excitatory postsynaptic currents (mEPSCs) were significantly reduced at P12-13; (2) the amplitude, mean frequency and charge transfer of miniature inhibitory postsynaptic currents (mIPSCs) were significantly increased at P12-13; (3) the kinetics (rise time and decay time) of both mEPSCs and mIPSCs accelerated with age; (4) the amplitude and frequency of spontaneous EPSCs were significantly reduced at P12-13, whereas those of spontaneous IPSCs were significantly increased at P12-13; and (5) both glycine and GABA contributed to mIPSCs. However, GABAergic currents fluctuated within a narrow range during the first three postnatal weeks, whereas glycinergic ones exhibited age-dependent changes comparable to those of total mIPSCs, indicating a reversal in dominance from GABA to glycine with development. Thus, our results provide strong electrophysiological evidence for an excitatory-inhibitory imbalance in HMs during the critical period of postnatal development in rats that may have significant implications for SIDS.


Figures

Figure 1
Figure 1. Amplitudes, frequencies and charge transfer of mEPSCs changed with age in HMs
Whole-cell patch-clamp recordings were made at a holding potential of –70 mV in the presence of 0.5 μm TTX, 10 μm bicuculline and 1 μm strychnine. A, traces of mEPSCs recorded at different postnatal days (P1, P3, P7, P12 and P16). B, cumulative probability of amplitudes of mEPSCs at P1, P12 and P16. The shift to the left from P1 to P12 was significant (P < 0.001), as was the shift back to the right from P12 to P16 (P < 0.01). C, mean amplitudes (in pA) of mEPSCs from P0 to P16. The amplitude decreased significantly at P3 (P < 0.05), P12 (P < 0.001) and remained low at P13. D, mean frequencies (in Hz) of mEPSCs from P0 to P16. It has a significant rise at P5 (P < 0.05). E, the charge transfer of mEPSCs from P0 to P16. It was significantly increased at P4 (P < 0.05) but was significantly decreased at P12–P13 (P < 0.05). Data are presented as mean ± SEM. *P < 0.05; ***P < 0.001 (significance between one age group and its adjacent younger age group).
Figure 2
Figure 2. The rise time and decay time of mEPSCs accelerated with age
A, the 10–90% rise time of mEPSCs accelerated with development. A significant day-to-day reduction occurred only at P12 (P < 0.05). B, the decay time to 37% of peak amplitude of mEPSCs accelerated with age. Data are presented as mean ± SEM. *P < 0.05 (significance between one age group and its adjacent younger age group).
Figure 3
Figure 3. Amplitudes, frequencies and charge transfer of mIPSCs changed with age in HMs
Whole-cell patch-clamp recordings were made at a holding potential of –70 mV in the presence of 0.5 μm TTX and glutamate antagonists CNQX (10 μm) and d-APV (25 μm). A, traces of mIPSCs recorded at different postnatal days (P1, P3, P7, P12 and P16). B, cumulative probability of amplitude distribution of mIPSCs at P1, P12 and P16. The shift from P1 to P12 was significant (P < 0.01), as was the shift from P12 to P16 (P < 0.01). C, mean amplitudes of mIPSCs from P0 to P16. The amplitude increased markedly at the end of the 2nd postnatal week, reaching significance at P12 (P < 0.001), P14 (P < 0.05) and P16 (P < 0.001), with a dip at P15 (P < 0.05). D, mean frequencies of mIPSCs increased with age from P0 to P16, with a significant rise at P3 (P < 0.001) and at P12 (P < 0.05). E, the charge transfer of mIPSCs from P0 to P16. It has a significant rise at P12 (P < 0.05). Data are presented as the mean ± SEM. *P < 0.05; ***P < 0.001 (significance between one age group and its adjacent younger age group).
Figure 4
Figure 4. The 10–90% rise time and decay time of mIPSCs accelerated with age
A, the 10–90% rise time of mIPSCs accelerated with development. B, the decay time to 37% of peak amplitude of mIPSCs accelerated with age, with a significant reduction at P7 (P < 0.001). Data are presented as the mean ± SEM. ***P < 0.001 (significance between one age group and its adjacent younger age group).
Figure 5
Figure 5. Amplitudes and frequencies of sEPSCs and sIPSCs changed with age in HMs
Whole-cell patch-clamp recordings were made at a holding potential of –70 mV in the absence of TTX but in the presence of 10 μm bicuculline and 1 μm strychnine for sEPSCs (A and C) or in the presence of 10 μm CNQX and 25 μm d-APV for sIPSCs (B and D). A, amplitudes of sEPSCs recorded at different postnatal days (P2, P7, P10–15). The value was significantly reduced at P12 (P < 0.05). B, amplitudes of sIPSCs recorded at different postnatal days (P2, P7, P10–15). The value was significantly increased at P12 and P15 (P < 0.05 for both). C, the frequency of sEPSCs was significantly increased at P7 (P < 0.05 as compared to P2) and P14 (P < 0.01 as compared to P13), but was significantly reduced at P12 (P < 0.05 as compared to P11) and remained low at P13. D, the frequency of sIPSCs was significantly increased at P12 (P < 0.05 as compared to P11). *P < 0.05; **P < 0.01.
Figure 6
Figure 6. GABAergic and glycinergic receptor-mediated IPSCs contributed to the total m- or s-IPSCs
A, in the presence of CNQX and d-APV, total mIPSCs were recorded in HMs at P10 at VH=−70 mV (control), followed by the application of 10 μm bicuculline for 3 min, washed for 6 min, before 1 μm strychnine was applied. After the application of both bicuculline and strychnine, currents were blocked almost entirely. B, total sIPSCs were recorded for 3 min (control), followed by the application of 10 μm bicuculline for 3 min, washed for 6 min, 1 μm strychnine for 3 min, and washed again for 30 min. Note that time scales in A and B are different.
Figure 7
Figure 7. Developmental changes in the properties of glycinergic and GABAergic mIPSCs
A, the amplitudes of glycinergic mIPSCs increased gradually with age. There were significant increases at P3, P12 (P < 0.05 for both) and P15 (P < 0.01), and a significant decrease at P5 (P < 0.05). B, the amplitude of GABAergic mIPSCs oscillated with age, with a significant decrease at P15 (P < 0.05). C, the 10–90% rise time of glycinergic mIPSCs decreased with development, with a significant decrease at P13 (P < 0.05). D, the 10–90% rise time of GABAergic mIPSCs fluctuated with development, with significant decreases at P9 (P < 0.05), but a significant increase at P11 (P < 0.01). E, the decay time of glycinergic mIPSCs accelerated with development. A significant decrease occurred at P13 (P < 0.05). F, the decay time of GABAergic mIPSCs fluctuated with development, with no statistical significant day-to-day difference from P0 to P16. Statistically significant differences were found between P0 and P16 for all three parameters of glycinergic mIPSCs (P < 0.01 for all), but not for those of GABAergic mIPSCs. Data are presented as mean ± SEM. *P < 0.05; **P < 0.01 (significance between one age group and its adjacent younger age group).
Figure 8
Figure 8. Developmental changes in the prevalence of GABAergic and glycinergic transmission
A, representative single currents for GABA, glycine and their co-release. B, the per cent contributions of GABA and glycine to total mIPSCs. GABA contributions had an age-dependent decrease, whereas that of glycine was increased between P0 and P16.

Similar articles

Cited by

References

    1. Aldes LD, Chapman ME, Chronister RB, Haycock JW. Sources of noradrenergic afferents to the hypoglossal nucleus in the rat. Brain Res Bull. 1992;29:931–942. - PubMed
    1. Ballanyi K. Neuromodulation of the perinatal respiratory network. Curr Neuropharm. 2004;2:221–243. - PubMed
    1. Bekkers JM, Stevens CF. Presynaptic mechanism for long-term potentiation in the hippocampus. Nature. 1990;346:724–729. - PubMed
    1. Berger AJ, Bayliss DA, Viana F. Development of hypoglossal motoneurons. J Appl Physiol. 1996;81:1039–1048. - PubMed
    1. Burgard EC, Hablitz JJ. NMDA receptor-mediated components of miniature excitatory synaptic currents in developing rat neocortex. J Neurophysiol. 1993;70:1841–1852. - PubMed

Publication types

MeSH terms

LinkOut - more resources