. 2011 Jun 1;589(Pt 11):2887-99.
doi: 10.1113/jphysiol.2011.206730. Epub 2011 Apr 11.

Volume regulation in mammalian skeletal muscle: the role of sodium-potassium-chloride cotransporters during exposure to hypertonic solutions

Affiliations

Volume regulation in mammalian skeletal muscle: the role of sodium-potassium-chloride cotransporters during exposure to hypertonic solutions

Michael I Lindinger et al. J Physiol. .

Abstract

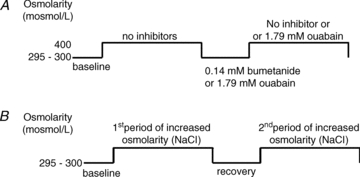
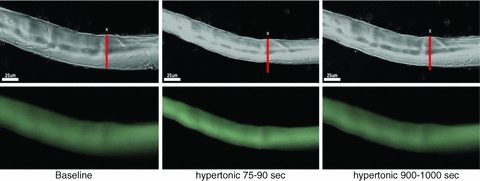
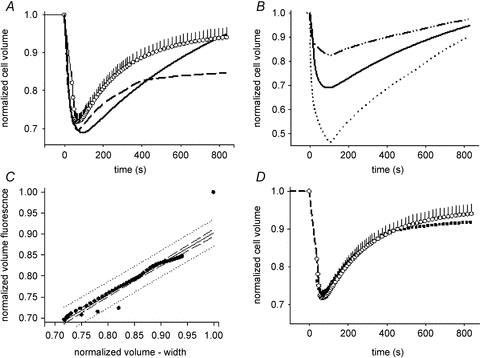
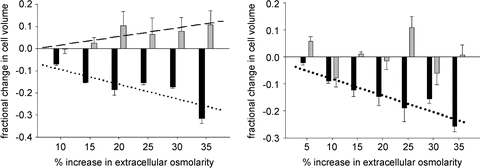
Controversy exists as to whether mammalian skeletal muscle is capable of volume regulation in response to changes in extracellular osmolarity despite evidence that muscle fibres have the required ion transport mechanisms to transport solute and water in situ. We addressed this issue by studying the ability of skeletal muscle to regulate volume during periods of induced hyperosmotic stress using single, mouse extensor digitorum longus (EDL) muscle fibres and intact muscle (soleus and EDL). Fibres and intact muscles were loaded with the fluorophore, calcein, and the change in muscle fluorescence and width (single fibres only) used as a metric of volume change. We hypothesized that skeletal muscle exposed to increased extracellular osmolarity would elicit initial cellular shrinkage followed by a regulatory volume increase (RVI) with the RVI dependent on the sodium–potassium–chloride cotransporter (NKCC). We found that single fibres exposed to a 35% increase in extracellular osmolarity demonstrated a rapid, initial 27–32% decrease in cell volume followed by a RVI which took 10-20 min and returned cell volume to 90–110% of pre-stimulus values. Within intact muscle, exposure to increased extracellular osmolarity of varying degrees also induced a rapid, initial shrinkage followed by a gradual RVI, with a greater rate of initial cell shrinkage and a longer time for RVI to occur with increasing extracellular tonicities. Furthermore, RVI was significantly faster in slow-twitch soleus than fast-twitch EDL. Pre-treatment of muscle with bumetanide (NKCC inhibitor) or ouabain (Na+,K+-ATPase inhibitor), increased the initial volume loss and impaired the RVI response to increased extracellular osmolarity indicating that the NKCC is a primary contributor to volume regulation in skeletal muscle. It is concluded that mouse skeletal muscle initially loses volume then exhibits a RVI when exposed to increases in extracellular osmolarity. The rate of RVI is dependent on the degree of change in extracellular osmolarity, is muscle specific, and is dependent on the functioning of the NKCC and Na+, K+-ATPase.


Figures

Figure 1
Figure 1. Design of intact muscle experiments
A, experimental protocol for performing experiments in the absence and presense of 1.79 mm bumetanide (NKCC inhibitor) and ouabain (Na+,K+-ATPase inhibitor). B, experimental protocol for performing the dose response to increased extracellular osmolarity.
Figure 2
Figure 2. Myocytes lose volume when exposed to increased extracellular osmolarity and then regain volume
Baseline; 75–90 s; 900–1000 s. Time course of fibre width (top images) and fluorescence (bottom images) in response to increased extracellular osmolarity. Cell volume loss was characterized by decrease in width simultaneous to increase in calcein fluorescence intensity (see Fig. 3).
Figure 3
Figure 3. Equating changes in muscle calcein fluorescence with changes in cellular volume
A, time course of change in cell volume during exposure to a 35% increase in extracellular osmolarity. Normalized cell volume was calculated using change in width (○, with SEM bars; n = 8 sections from 4 fibres from 2 mice; [1 – (WoWt)]/Wo), or using change in fibre fluorescence intensity ([1 – (FoFt)]/Fo), dashed line), and using Crowe et al.'s (1995) equation with our experimentally determined Fbkg of 0.43 (continuous line; same continuous line as in B). This correction for background or ‘trapped’ intracellular fluorescence produced a result that was not statistically different from the fibre width data, but clearly has shortcomings with respect to accurately portraying the time course of volume recovery. B, average (n = 8 sections from 4 fibres from 2 mice) change in normalized cell volume calculated as the ratio of the baseline fluorescence (Fo): fluorescence at time t (Ft) (dashed–dotted line) and using eqn (1) using Crowe et al.'s (1995)Fbkg of 0.67 (dotted line) and our experimentally determined Fbkg of 0.43 (continuous line; same continuous line as in panel A). C, linear regression analysis results of fitting the ‘corrected’ fibre fluorescence (continuous lines of A and B) to the change in volume based on fibre width. D, the time course of change in cell volume calculated from change in fibre width (same data as in A) and from the final fluorescence data (▪) corrected for Fbkg (0.43) and fitted using the linear regression equation.
Figure 4
Figure 4. Fibre type differences in volume loss and RVI responses
A, time course of normalized cell volume change in typical intact EDL (continuous line) and soleus (dashed line) muscles exposed to a 35% increase in extracellular osmolarity at 0 s. B, time course of normalized cell volume change in a typical intact EDL muscle (continuous line, same as in A) and after incubation with 0.14 mm bumetanide for 30 min prior to a 35% increase in extracellular osmolarity at 0 s in the subsequent absence (dashed line) of bumetanide. C, normalized volume responses from both sides of an EDL muscle (continuous and dotted lines) incubated with 1.79 mm ouabain for 30 min, followed by a step increase in extracellular osmolarity of 20 mosmol l−1 by addition of NaCl in the presence of ouabain at 0 s. When ouabain was not present during the period of increased osmolarity, resulting in gradual loss of inhibition of Na+,K+-ATPase activity, there was a delayed, though rapid, regulatory volume increase (dashed line).
Figure 5
Figure 5. Peak volume loss (black bars) and volume recovery (grey bars), relative to initial baseline volume in soleus (left panel) and EDL (right panel)
The bars represent means and SEM. Values greater than 0 represent an overshoot of the volume recovery. n = 4 for each osmolarity, except soleus 30% where n = 7 and EDL 5% where n = 3. The lines indicate significant linear relationships between the increase in extracellular osmolarity and peak volume loss and recovery for SOL, and only for volume loss for EDL. See text for additional details.

Comment in

Similar articles

Cited by

References

    1. Antolic A, Harrison R, Farlinger C, Cermak NM, Peters SJ, LeBlanc P, Roy BD. The effect of ectracellular osmolarity on cell volume and resting metabolism in mammalian skeletal muscle. Am J Physiol Regul Integr Comp Physiol. 2007;292:R1994–R2000. - PubMed
    1. Bressler BH. Isometric tension and instantaneous stiffness in amphibian skeletal muscle exposed to solutions of increased osmolarity. Can J Physiol Pharmacol. 1977;55:1208–1210. - PubMed
    1. Bressler BH, Matsuba K. Tension and instantaneous stiffness of single muscle fibres immersed in Ringer solution of decreased osmolarity. Biophys J. 1991;59:1002–1006. - PMC - PubMed
    1. Cermak NM, LeBlanc PJ, Peters SJ, Vandenboom R, Roy BD. Effect of extracellular osmolality on metabolism in contracting mammalian skeletal muscle in vitro. Appl Physiol Nutr Metab. 2009;34:1055–1064. - PubMed
    1. Crowe WE, Altamirano J, Huerto L, Alvarez-Leefmans FJ. Volume changes in single N1E-115 neuroblastoma cells measured with a fluorescent probe. Neuroscience. 1995;69:283–296. - PubMed

MeSH terms

LinkOut - more resources