. 2011 Jun 1;589(Pt 11):2781-93.
doi: 10.1113/jphysiol.2011.205807. Epub 2011 Apr 11.

Axonal failure during high frequency stimulation of rat subthalamic nucleus

Affiliations

Axonal failure during high frequency stimulation of rat subthalamic nucleus

Fang Zheng et al. J Physiol. .

Abstract

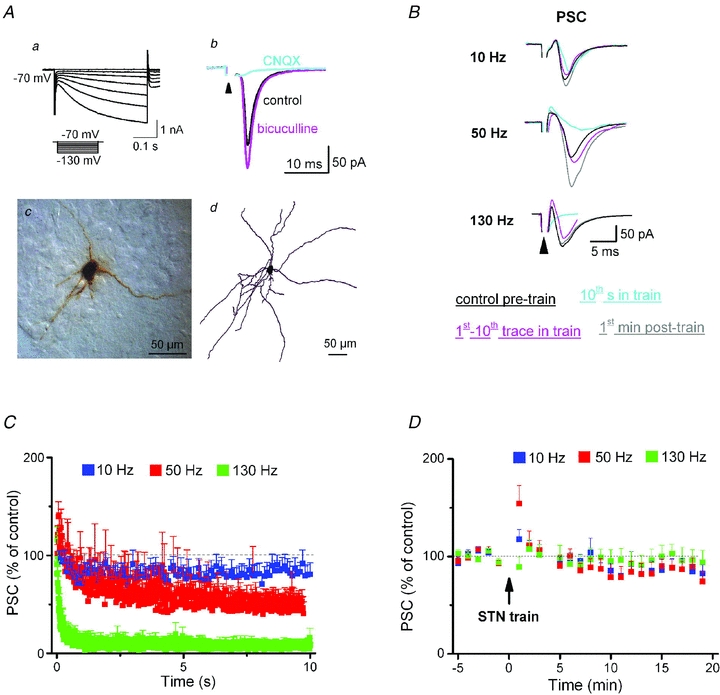
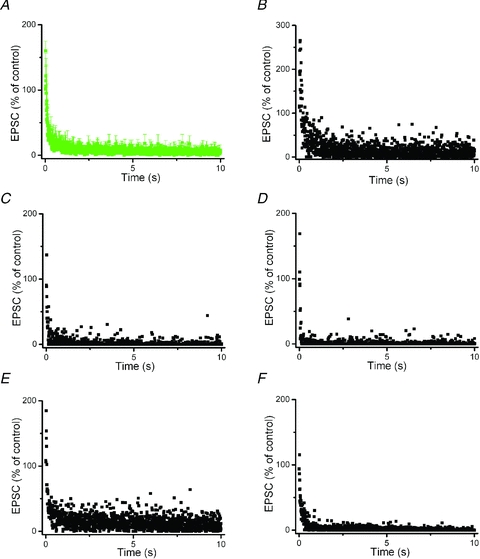
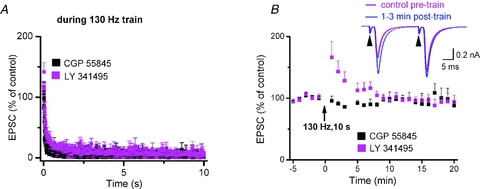
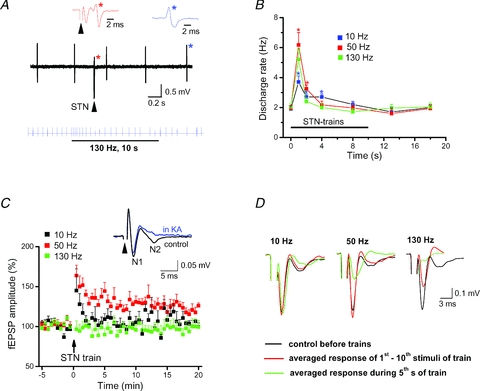
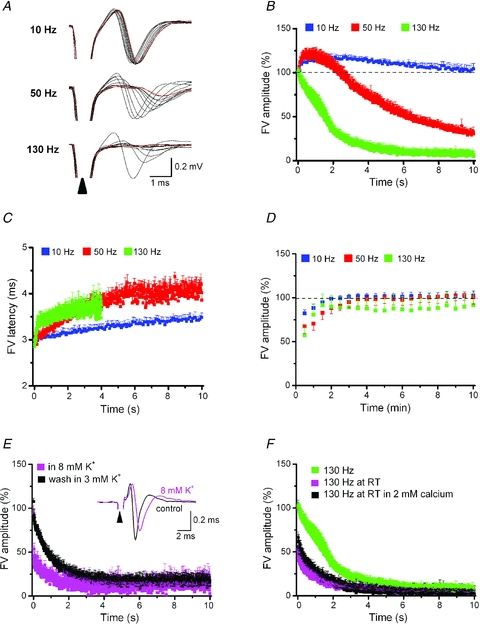
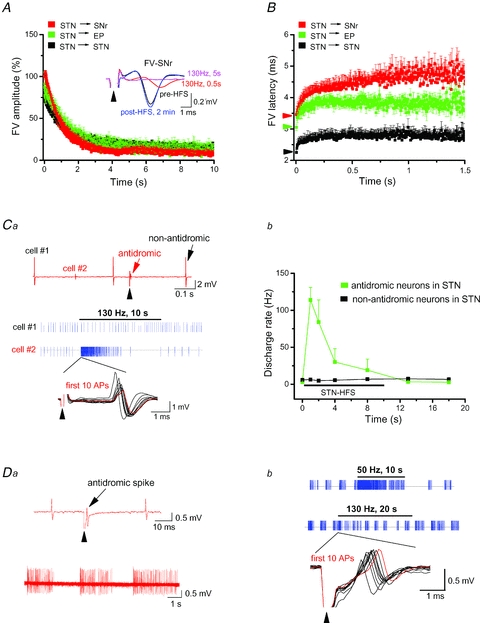
Deep brain stimulation (DBS) has been established as an effective surgical therapy for advanced Parkinson's disease (PD) and gains increasing acceptance for otherwise intractable neuropsychiatric diseases such as major depression or obsessive–compulsive disorders. In PD, DBS targets predominantly the subthalamic nucleus (STN) and relieves motor deficits only at high frequency (>100 Hz). In contrast to the well-documented clinical efficacy of DBS, its underlying principle remains enigmatic spawning a broad and, in part, contradictory spectrum of suggested synaptic and non-synaptic mechanisms within and outside STN. Here we focused on a crucial, but largely neglected issue in this controversy, namely the axonal propagation of DBS within and away from STN. In rat brain slices preserving STN projections to substantia nigra (SN) and entopeduncular nucleus (EP, the rodent equivalent of internal globus pallidus), STN-DBS disrupted synaptic excitation onto target neurons through an unexpected failure of axonal signalling. The rapid onset and, upon termination of DBS, recovery of this effect was highly reminiscent of the time course of DBS in the clinical setting. We propose that DBS-induced suppression of axonal projections from and to STN serves to shield basal ganglia circuitry from pathological activity arising in or amplified by this nucleus.


Figures

Figure 1
Figure 1. STN-HFS silences synaptic transmission onto SNc dopaminergic neurons recorded in whole-cell voltage-clamp mode
Aa and b, dopaminergic neurons in SNc were identified by the characteristic activation of pronounced hyperpolarization-activated current (Ih) in response to hyperpolarizing voltage commands (a); they responded to single STN stimuli (indicated by arrowhead; 60 μs, 200 μA, stimulus artifact truncated) with brief postsynaptic current (PSC, b). PSC amplitude increased during superfusion with the GABAA receptor antagonist bicuculline (30 μm) and disappeared in the presence of the AMPA receptor antagonist CNQX (20 μm) (b). Ac and d, example of a biocytin-labelled SNc neuron in cryostat section (c) and after reconstruction using Neurolucida (d). B, superimposed traces from different neurons illustrate the frequency-dependent effect of STN trains (10 s long) on PSC amplitudes. C, plot of changes in normalized PSC amplitudes during stimulus trains demonstrates time- and frequency-dependent effects of STN stimulation (10 Hz, n = 10; 50 Hz, n = 10; 130 Hz, n = 9). Averaged PSC amplitudes at the end of train were 82 ± 11%, 48 ± 11% and 12 ± 8% of control for 10 Hz, 50 Hz and 130 Hz, respectively. Note that 50 Hz and 130 Hz trains caused an initial transient increase in PSC amplitude. D, plot of grouped data before and after STN trains shows rapid recovery of PSC amplitude to pre-train levels after cessation of trains. STN was stimulated at 0.1 Hz before and after train, with pulse width of 60 μs and intensity of 200–1000 μA. Each data point in D represents the average of 6 consecutive recordings.
Figure 2
Figure 2. Rapid rundown of excitatory postsynaptic currents (EPSCs) in voltage-clamped SNc dopaminergic neurons during STN-HFS
EPSCs were recorded in the presence of GABAA receptor antagonist picrotoxin (100 μm). A, averaged normalized EPSC responses from the five neurons shown in B–F. B–F, changes of EPSC responses during STN-HFS train (130 Hz, 10 s) in five individual neurons. EPSC responses were normalized to their amplitude before STN-HFS. Note incomplete suppression of EPSCs during HFS, with sporadic large-amplitude responses. Mean EPSC amplitude at the end of HFS train was 5 ± 2% of control (n = 5).
Figure 3
Figure 3. Effects of GABAB receptor and metabotropic glutamate receptor antagonists on EPSCs of SNc dopaminergic neurons during and after STN-HFS
A, the GABAB receptor antagonist CGP 55845 (2 μm, n = 9) and the mGluRII antagonist LY 341495 (100 nm, n = 7) failed to relieve the synaptic depression during HFS train. B, grouped data before and after HFS-trains indicate rapid recovery of EPSC after termination of HFS. Note that mGluRII antagonist transiently enhanced EPSCs immediately after termination of HFS. In some experiments, we employed a paired-pulse protocol, in which two identical stimuli (inter-pulse interval of 25 ms) were delivered to STN and resulted in a facilitated second response (inset). The transient increase in the 1st EPSC in the presence of mGluRII antagonist was accompanied by reduction in paired-pulse ratio.
Figure 4
Figure 4. Effects of STN-HFS on single unit activity and field potentials in SNc
All recordings were made in the presence of picrotoxin (100 μm). A, upper black trace of original recording illustrates single unit activity of a rhythmically discharging SNc dopaminergic neuron that was orthodromically activated by single STN stimulation. Note the out-of-rhythm discharge (red star) after STN stimulation (arrowhead; 90 μs, 200 μA). Coloured traces above depict the waveforms of unit discharge (like-coloured stars) at expanded time scale. Lower blue trace of spike events demonstrates transient increase of single-unit activity when STN-HFS begins. Note that the neuron quickly resumed baseline firing pattern despite sustained delivery of HFS train. B, plot quantifies brief transient increases in firing rate after start of stimulus trains at different frequencies (10 Hz, n = 6; 50 Hz, n = 6; 130 Hz, n = 5; *P < 0.05). C, electrical stimulation in STN evoked biphasic field potentials in SNc, consisting of an early axonal component (N1) termed fibre volley (FV) and a late synaptic component (N2). Latencies to peak were 3.0 ± 0.1 ms for N1 and 7.5 ± 0.5 ms for N2 (n = 11). The latter N2 reflects field EPSP as indicated by its sensitivity to the unselective ionotropic glutamate receptor antagonist kynurenic acid (KA, 2 mm; inset). Plot depicts normalized N2 component before and after STN trains of different frequencies (10 Hz, n = 7; 50 Hz, n = 9; 130 Hz, n = 11). Both 10 Hz and 50 Hz trains induced short-term potentiation, but only stimulation at 50 Hz was able to induce long-term potentiation of field EPSP (122 ± 4% of control, averaged over 16th–20th min post train, n = 9). Note that HFS (130 Hz) failed to induce either form of plasticity. STN was stimulated at 0.1 Hz before and after train, with pulse width of 90 μs and intensity of 100–300 μA. D, averaged field potentials recorded in SNc before and at two time points during 10 s stimulus trains of different frequencies delivered to STN (stimulus intensity 200 μA). Note strong and virtually complete suppression of fibre volley (N1) in the course of 130 Hz stimulation.
Figure 5
Figure 5. Reversible axonal failure during STN-HFS
FVs were recorded in bath solution containing reduced calcium (0.2 mm), picrotoxin (100 μm) and kynurenic acid (2 mm) to abrogate synaptic potentials. A, selected FV responses (every 1 s) elicited by STN trains of 10, 50 or 130 Hz were superimposed to show gradual shift in latency and peak amplitude. Most leftward black trace and red trace indicate first and last FV response, respectively, in each sequence. Sample traces were collected in a single recording session with inter-train intervals of 30 min each. Plots of normalized FV amplitudes (B) and averaged FV latencies (C) recorded in SNc during 10 s stimulus trains delivered to STN at different frequencies (10 Hz, n = 5; 50 Hz, n = 5; 130 Hz, n = 8). Averaged FV amplitudes at the end of train were 103 ± 6%, 26 ± 5% and 8 ± 4% of control for 10 Hz, 50 Hz and 130 Hz, respectively. STN trains for 10 s at 10 Hz and 50 Hz increased FV latency from 3.0 ± 0.1 ms to 3.5 ± 0.1 ms (P = 0.01) and to 4.0 ± 0.2 ms (P = 0.02), respectively. In view of the progressive decline of FVs during HFS (130 Hz), latencies were only determined over 4 s (from 3.0 ± 0.1 ms to 3.5 ± 0.1 ms at 4th s, P = 0.002). D, amplitude of FVs recovered quickly to pre-train level after cessation of trains. E, raising [K+]o from 3 mm to 8 mm expedited FV rundown during STN-HFS in a reversible fashion (n = 5). Inset depicts superimposed FV responses to single STN stimulus in control and high [K+]o solution. Elevation of [K+]o increased latency to negative peak from 2.9 ± 0.2 ms to 3.4 ± 0.3 ms (P = 0.03) and reduced peak amplitude from 0.34 ± 0.03 mV to 0.23 ± 0.03 mV (P = 0.01; n = 5). F, lowering bath temperature to room temperature (RT) accelerated rundown of FV amplitude during HFS independent of extracellular calcium concentration (0.2 mm, n = 4; 2 mm, n = 6). For comparison, we replotted here the decay of FV amplitude at control (high) temperature already shown in B (green symbols each).
Figure 6
Figure 6. STN-HFS disrupts axonal conduction within STN and towards basal ganglia output nuclei
Plots of normalized FV amplitudes (A) and averaged FV latencies (B) during STN-HFS recorded within STN (n = 9), in SN reticulata (SNr, n = 7) and in entopeduncular nucleus (EP, n = 6). Averaged FV amplitudes at the end of HFS were 15 ± 2%, 8 ± 2% and 12 ± 2% of control for STN, SNr and EP, respectively. Inset in A depicts superimposed FVs recorded in SNr in response to STN stimulation (arrowhead, 90 μs, 200 μA) at different time points before, during and after HFS as indicated. Coloured arrowheads along the y-axis of B indicate control values for FV latency in like-coloured target regions. STN-HFS increased FV latency from 2.3 ± 0.1 ms to 2.8 ± 0.1 ms (P = 0.001) for STN, from 3.2 ± 0.1 ms to 3.8 ± 0.1 ms (P = 0.001) for EP and from 3.5 ± 0.2 ms to 4.5 ± 0.2 ms (P = 0.001) for SNr, respectively, measured at 1–1.5 s after switching on HFS trains. Note the different time scale along the x-axis in B. C and D single unit recordings of rhythmically firing STN neurons. Ca, impact of HFS on two simultaneously recorded, tonically firing neurons in STN. As indicated in the upper original trace, single STN stimulation (arrowhead, 90 μs, 200 μA) did not affect the spontaneous discharge of cell no. 1, but produced antidromic activation of cell no. 2. The spike event traces (blue, middle part) illustrate differential effect of STN-HFS on the firing pattern of the two cells. The first 10 action potentials of cell no. 2 at the beginning of HFS are superimposed and shown at expanded time scale below corresponding blue trace to demonstrate gradual shift in amplitude and latency of antidromic spike. Red trace represents last (10th) spike in this series. Cb, plot quantifying the transient effect of HFS on firing rate in antidromically activated STN neurons (n = 4, green). Non-antidromically activated STN neurons (n = 12, black) displayed unchanged activity during HFS. The antidromic spikes faithfully followed 10 Hz and 50 Hz during 10 s trains (data not shown). Da, STN neuron with burst firing pattern (lower trace) was antidromically activated by STN stimulation (arrowhead, 90 μs, 250 μA; upper trace). Db, STN-HFS transiently enhanced firing frequency during first few seconds (lower blue trace), in contrast to the massive increase with 50 Hz stimulation (upper blue trace). Recordings are from the burst-firing neuron of Da (similar data from two other burst-firing neurons are not illustrated). The first 10 action potentials at the beginning of HFS are superimposed and shown at expanded time scale below blue trace to demonstrate gradual shift in latency of antidromic spike. Trace in red represents last (10th) spike in this series.

Similar articles

Cited by

References

    1. Ammari R, Lopez C, Bioulac B, Garcia L, Hammond C. Subthalamic nucleus evokes similar long lasting glutamatergic excitations in pallidal, entopeduncular and nigral neurons in the basal ganglia slice. Neuroscience. 2010;166:808–818. - PubMed
    1. Ammari R, Lopez C, Fiorentino H, Gonon F, Hammond C. A mouse juvenile or adult slice with preserved functional nigro-striatal dopaminergic neurons. Neuroscience. 2009;159:3–6. - PubMed
    1. Bekar L, Libionka W, Tian GF, Xu Q, Torres A, Wang X, Lovatt D, Williams E, Takano T, Schnermann J, Bakos R, Nedergaard M. Adenosine is crucial for deep brain stimulation-mediated attenuation of tremor. Nat Med. 2008;14:75–80. - PubMed
    1. Bellinger SC, Miyazawa G, Steinmetz PN. Submyelin potassium accumulation may functionally block subsets of local axons during deep brain stimulation: a modeling study. J Neural Eng. 2008;5:263–274. - PubMed
    1. Beurrier C, Ben-Ari Y, Hammond C. Preservation of the direct and indirect pathways in an in vitro preparation of the mouse basal ganglia. Neuroscience. 2006;140:77–86. - PubMed

MeSH terms

LinkOut - more resources