. 2011 Jun 1;589(Pt 11):2795-812.
doi: 10.1113/jphysiol.2010.194076. Epub 2011 Apr 11.

Transmission of colour and acuity signals by parvocellular cells in marmoset monkeys

Affiliations

Transmission of colour and acuity signals by parvocellular cells in marmoset monkeys

Paul R Martin et al. J Physiol. .

Abstract

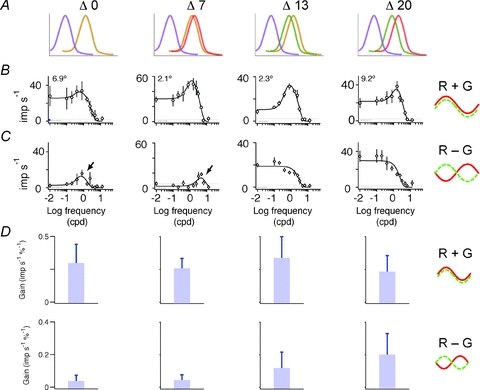
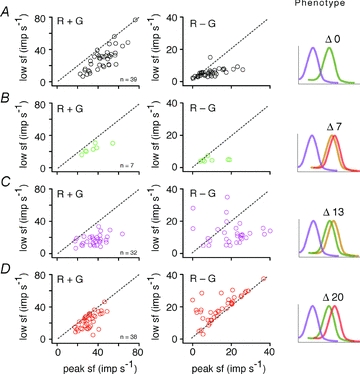
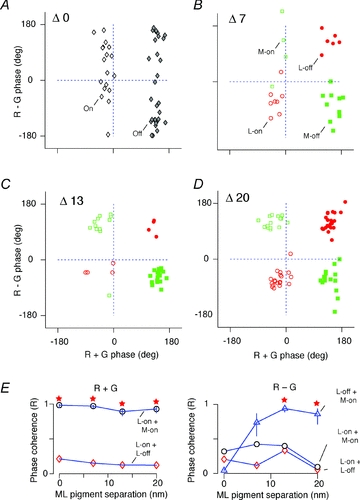
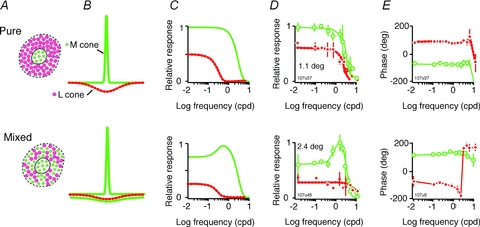
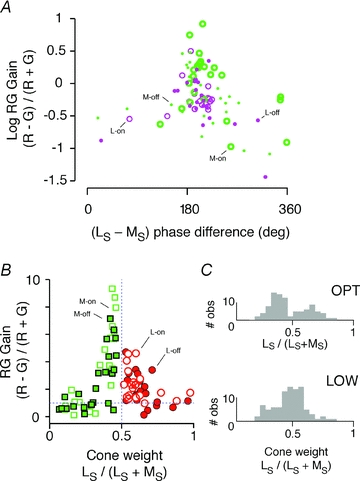
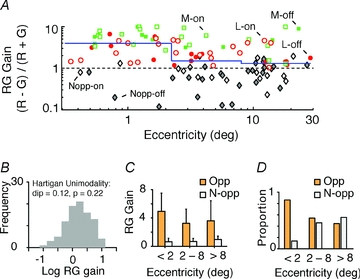
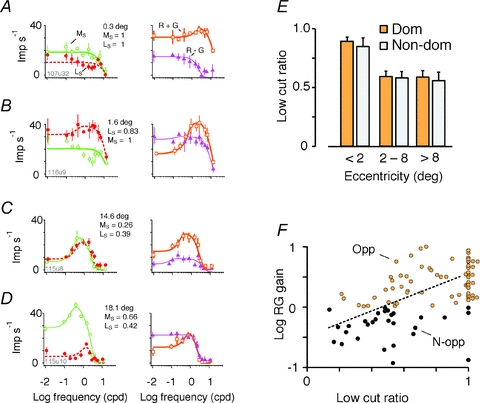
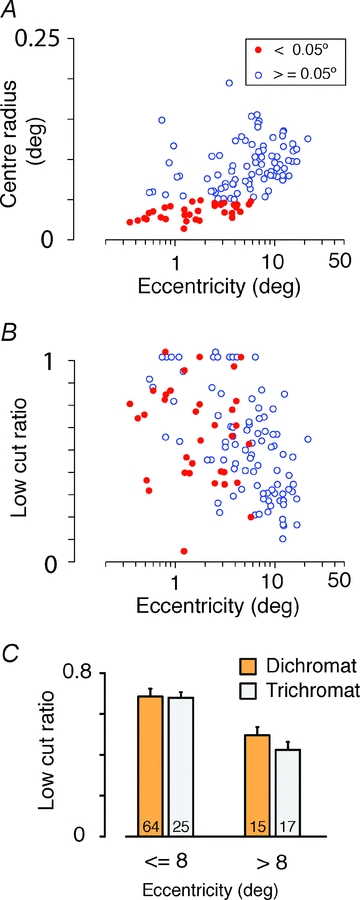
The red-green axis of colour vision evolved recently in primate evolutionary history. Signals serving red-green colour vision travel together with signals serving spatial vision, in the parvocellular (PC) division of the subcortical visual pathway. However, the question of whether receptive fields of PC pathway cells are specialized to transmit red-green colour signals remains unresolved. We addressed this question in single-cell recordings from the lateral geniculate nucleus of anaesthetized marmosets. Marmosets show a high proportion of dichromatic (red-green colour-blind) individuals, allowing spatial and colour tuning properties of PC cells to be directly compared in dichromatic and trichromatic visual systems. We measured spatial frequency tuning for sine gratings that provided selective stimulation of individual photoreceptor types. We found that in trichromatic marmosets, the foveal visual field representation is dominated by red-green colour-selective PC cells. Colour selectivity of PC cells is reduced at greater eccentricities, but cone inputs to centre and surround are biased to create more selectivity than predicted by a purely 'random wiring' model. Thus, one-to-one connections in the fovea are sufficient, but not necessary, to create colour-selective responses. The distribution of spatial tuning properties for achromatic stimuli shows almost complete overlap between PC cells recorded in dichromatic and trichromatic marmosets. These data indicate that transmission of red-green colour signals has been enabled by centre-surround receptive fields of PC cells, and has not altered the capacity of PC cells to serve high-acuity vision at high stimulus contrast.


Figures

Figure 1
Figure 1. Accuracy of cone contrast calculations
A and B, response amplitude and phase of a PC cell in a dichromatic marmoset as a function of the relative intensity (RG balance) of out-of -phase modulated red and green monitor guns. Arrows above the graphs show the predicted silent substitution (s) ratio for cone mechanisms at the indicated peak wavelength. Note sharp response minimum and phase reversal corresponding to the predicted value for the 556 nm cone. Horizontal lines beneath the amplitude graph in A show the mean (symbols) and range of response minima in samples of PC cells from three dichromatic marmosets. Note that minima are located close to predictions for a single cone mechanism: minima for animals MY97 and MY101 are close to the prediction for 556 nm and minima for animal MY103 are close to the prediction for 543 nm. C and D, response amplitude and phase in a PC cell from a 543 nm/563 nm (Δ13 nm) phenotype marmoset. Note the lack of clear response minimum across the range of relative intensities tested.
Figure 2
Figure 2. Colour and luminance signals in marmoset PC cells
Each column shows responses of an example cell for each marmoset colour vision phenotype. A, sketches of the cone complement. The spectral separation between long (L) and medium (M) wavelength-sensitive cones is indicated above each sketch. Note that none of the PC cells recorded showed significant functional input from short-wavelength-sensitive cones. B, spatial frequency modulation transfer functions for in-phase (R + G, ‘luminance’) modulated gratings. C, spatial frequency modulation transfer functions for out-of-phase (R − G, ‘chromatic’) modulation. In all phenotypes, the luminance transfer function shows bandpass characteristics, with peak spatial frequency at 1–5 cycles deg−1 (cpd). In the Δ13 and Δ20 nm phenotypes, responses to chromatic modulation are present at low spatial frequencies. The spatial/temporal profile of cone modulation is sketched to the right of the graphs. Continuous line, L cone; dashed line, M cone. Error bars show standard deviations. Inset values in B show receptive field distance from the fovea. D, bar graphs showing mean and standard deviation for each measured cohort for R + G (upper row) and R − G stimuli (lower row).
Figure 3
Figure 3. Summary of spatial transfer properties
Response amplitude estimates were recovered from difference of Gaussians (DOG) fits to the fundamental Fourier component at the spatial frequency (sf) of the stimulus. Upper row (A) shows pooled data from dichromatic marmosets (n = 39). The other rows show data from trichromatic marmosets with peak M and L cone sensitivities as follows: 556 nm/563 nm (Δ7 nm; B); 543 nm/563 nm (Δ13 nm; C); and 543 nm/563 nm (Δ20 nm; D). The cone complements are shown schematically together with the spectral separation of M and L pigments in the right column. Left column, R + G modulation. The majority of data points lie below the unity line, indicating centre–surround antagonism. Right column, L–M modulation. Most points for the Δ20 nm phenotype, and a smaller number of points for the Δ13 nm phenotype, lie above the unity line, indicating low-pass spatial tuning.
Figure 4
Figure 4. Phase coherence of PC cell cohorts
A–D, each scatter plot shows the response phase for R + G modulation (x-axis) against R − G modulation (y-axis) for one phenotype as indicated at the top left of the plot. Note the wide phase dispersion for R − G modulation in the dichromatic phenotype. E, phase coherence and spectral separation of L and M cones. Coherence is high across like (on- or off-) response sign for R + G modulation (left panel), and for opposite response sign for R − G modulation (right panel). Stars indicate P < 0.01 (Rayleigh test for uniform circular distribution).
Figure 5
Figure 5. Segregation of M and L cone inputs to PC cells
A, hypothetical arrangement of cone inputs to a PC receptive field. Both examples show exclusive excitatory (centre) input from M cones. Upper example shows exclusive inhibitory (surround) input from L cones. Lower example shows mixed input of M and L cones to the surround. B, DOG model functions to approximate the input weighting functions for these distributions, where each cone contributes to a separate DOG. C, frequency spectra of these DOG functions. Note that the upper example predicts low-pass frequency tuning for M cones, whereas the lower example predicts bandpass tuning for M cones. D, spatial frequency tuning curves from two PC cells consistent with the predicted pattern. For ease of comparison with the DOG model, normalized responses to cone-selective gratings are shown. Continuous line, DOG fit to M-cone-selective (MS) gratings. Dashed line, DOG fit to L-cone-selective (LS) gratings. Cone weight [LS/(LS+ MS)] and RG gain values are as follows: upper row, 0.42 and 3.73; lower row, 0.39 and 3.24, respectively.
Figure 6
Figure 6. Range of chromatic selectivity in PC cells
A, response phase difference between L-cone-selective (LS) gratings and M-cone-selective (MS) gratings compared with red–green chromatic sensitivity (RG gain). Phase is referenced to the dominant (M or L) centre cone. B, relative response amplitude for LS and MS gratings compared with RG gain. Note the wide range of cone weights, and that cells with approximately equally weighted L and M cone inputs show higher RG gain. C, histograms showing how distribution of cone weights for LS and MS gratings becomes broader with increasing spatial frequency, consistent with increased contribution of the excitatory cone mechanism to response amplitude.
Figure 7
Figure 7. Eccentricity dependence of RG gain in PC cells
A, RG gain of cells recorded in Δ13 and Δ20 nm phenotypes. Cells were classified into opponent (M-on, M-off, L-on and L-off) or non-opponent (Nopp-on and Nopp-off) groups according to the criteria described in the text. Note the presence of opponent cells throughout the eccentricity range studied, and the low proportion of non-opponent cells in the central-most two degrees. Continuous line shows median RG gain over three ranges: 0–2.2, 2.2–8 and 8–30 deg. B, frequency distribution of RG gain is unimodal, consistent with opponent (Opp) and non-opponent (N-opp) categories forming a single functional population. C, mean RG gain of opponent and non-opponent categories. Error bars show standard deviations. D, proportion of cells in opponent and non-opponent populations.
Figure 8
Figure 8. Surround inhibition reduces chromatic selectivity in PC cells
A–D, responses of four example cells to LS and MS gratings. The examples are sorted according to receptive field eccentricity. Data points show mean and standard deviation for the dominant cone mechanism. Continuous lines show DOG fits. Note increasing low-frequency roll-off with increasing eccentricity. Receptive field eccentricity and low cut ratio values extracted from DOG fits are shown to the right of each example. E, comparison of low cut ratio for dominant cone (Dom) and non-dominant cone (Non-dom) in three eccentricity ranges. F, relation of low cut ratio to RG gain. Dotted line shows linear regression for cells with low cut ratio <1; slope = 1.01, y-intercept = −0.47.
Figure 9
Figure 9. Spatial tuning in PC populations
Parameters were estimated from DOG fits to response amplitude for luminance (L + M) gratings. Pooled data from dichromatic and trichromatic phenotypes are shown. A, receptive field centre radius. Cells with radius below 0.05 deg are restricted to the central 10 deg eccentricity. B, low cut ratio. Note variation of low cut ratio among cells with small receptive fields, and eccentricity-dependent increase in low cut ratio. C, comparison of low cut ratio in dichromatic and trichromatic phenotypes.

Similar articles

Cited by

References

    1. Blakemore C, Vital-Durand F. Organization and post-natal development of the monkey's lateral geniculate nucleus. J Physiol. 1986;380:453–491. - PMC - PubMed
    1. Blessing EM, Solomon SG, Hashemi-Nezhad M, Morris BJ, Martin PR. Chromatic and spatial properties of parvocellular cells in the lateral geniculate nucleus of the marmoset (Callithrix jacchus) J Physiol. 2004;557:229–245. - PMC - PubMed
    1. Bowmaker JK, Jacobs GH, Mollon JD. Polymorphism of photopigments in the squirrel monkey: a sixth phenotype. Proc R Soc Lond B Biol Sci. 1987;231:383–390. - PubMed
    1. Boycott BB, Wässle H. Morphological classification of bipolar cells of the primate retina. Eur J Neurosci. 1991;3:1069–1088. - PubMed
    1. Brainard DH. Cone contrast and opponent modulation color spaces. In: Kaiser PK, Boynton GM, editors. Human Color Vision. Washington, DC: Optical Society of America; 1996. pp. 563–577.

Publication types

LinkOut - more resources