. 2011 May 1;589(Pt 9):2349-61.
doi: 10.1113/jphysiol.2010.202317. Epub 2011 Mar 14.

Role of feedforward geniculate inputs in the generation of orientation selectivity in the cat's primary visual cortex

Affiliations

Role of feedforward geniculate inputs in the generation of orientation selectivity in the cat's primary visual cortex

Sivaram Viswanathan et al. J Physiol. .

Abstract

Neurones of the mammalian primary visual cortex have the remarkable property of being selective for the orientation of visual contours. It has been controversial whether the selectivity arises from intracortical mechanisms, from the pattern of afferent connectivity from lateral geniculate nucleus (LGN) to cortical cells or from the sharpening of a bias that is already present in the responses of many geniculate cells. To investigate this, we employed a variation of an electrical stimulation protocol in the LGN that has been claimed to suppress intra cortical inputs and isolate the raw geniculocortical input to a striate cortical cell. Such stimulation led to a sharpening of the orientation sensitivity of geniculate cells themselves and some broadening of cortical orientation selectivity. These findings are consistent with the idea that non-specific inhibition of the signals from LGN cells which exhibit an orientation bias can generate the sharp orientation selectivity of primary visual cortical cells. This obviates the need for an excitatory convergence from geniculate cells whose receptive fields are arranged along a row in visual space as in the classical model and provides a framework for orientation sensitivity originating in the retina and getting sharpened through inhibition at higher levels of the visual pathway.


Figures
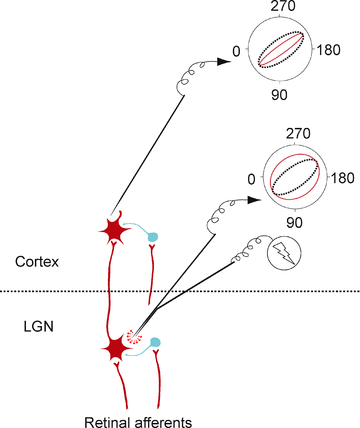
Figure 1
Figure 1. Schematic diagram of the experimental protocol and the predicted results
The dual electrode assembly in the LGN consists of one tungsten microelectrode for electrical stimulation and the other for electrophysiological recording; the cortical electrode is used for recording only. The larger neurones in red are principal cells in the LGN or layer IV stellate cells in the striate cortex. The smaller neurons in blue are inhibitory interneurones. The orientation sensitivity of the LGN and cortical cells are shown as polar diagrams on the right next to the respective recording electrodes. Control responses are shown in red continuous ellipses and the responses during the LGN electrical stimulation in dotted grey. According to the scheme proposed here, the inhibition caused by electrical stimulation in the LGN will be expected to sharpen the orientation bias of the LGN cell and the inhibition in the cortex will be expected to suppress intracortical excitation from neurons tuned to similar orientations, leaving the extracellular response mainly reflecting the raw LGN excitatory input and thus somewhat less selective to orientation.
Figure 2
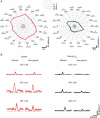
Figure 2. Raster plots for two cortical cells (left) and two LGN cells (right) during geniculate electrial stimulation (bottom row)
The top row shows the spike occurences during the presentation of the same visual stimuli as in the bottom row and triggered by the same trigger source as the bottom row, but without actually delivering any current pulses. The top row can thus be taken as showing ‘control’ responses and the bottom row as showing the degree of inhibition imposed on these responses by the LGN stimulation. The arrow indicates the time of occurrence of the electrical pulse. The visual and electrical stimulations, by chosing appropriate temporal parameters as explained in Methods, were not allowed to be correlated.
Figure 3
Figure 3. Effect of local electrical stimulation on orientation selectivity of cells in the lateral geniculate nucleus
A, polar diagrams of a Y-like LGN cell's responses to a light bar (10 deg × 0.5 deg, 5 deg s−1, 100% contrast, background luminance: 7 cd m−2) moving at different orientation directions before (left) and during (right) electrical stimulation (Estim) in the vicinity and the corresponding spike density functions at each orientation. The orientation tuning was done at 20 deg steps. Mean responses are shown with SEM. The receptive field was at 10 deg eccentricity in the inferior field. The inner continuous circle represents spontaneous activity. 0 deg represents a vertical bar moving from left to right in front of the animal. The orientations change in an anticlockwise fashion. Each division along the radii in the polar diagrams represents 10 spikes s−1. The scale bars for the spike density functions represent 2 s for the abscissa and 40 spikes s−1 for the ordinate. B, spike density functions (with 95% confidence intervals) for three other LGN cells at optimal and non-optimal directions for the same stimulus parameters as for the cell shown in A (top cell: Y-like; middle and bottom cells: X-like). The orientation sensitivity index (OSI) is shown above each spike density function, before (left, Control) and during (right, Estim) the electrical stimulation in the LGN. The scale bars represent 500 ms for the abscissa and 40 spikes s−1 for the ordinate.
Figure 4
Figure 4. Orientation sensitivity indices of all the LGN (circles) and area 17 (triangles) cells of our sample before (abscissa) and during (ordinate) enhancement of local inhibition in the LGN
This was done by electrical stimulation in the LGN (filled circles for LGN cells and open triangles for cortical cells) or iontophoresis of GABA in the LGN (open circles).
Figure 5
Figure 5. Polar diagrams showing the orientation sensitivity of three striate cortical cells before (in continuous red) and during (in dotted grey) electrical stimulation in the LGN
The stimulus was a bright bar (10 deg × 0.5 deg, 10 deg s−1, 100% contrast, background luminance: 7 cd m−2) moving at different orientation-directions. Mean responses are shown with SEM. The receptive fields of all three cells were at 0.5 deg eccentricity in the inferior field. The inner solid circle represents spontaneous activity. Each division along the radii represents 10 spikes s−1. 0 deg represents a vertical bar moving from left to right in front of the animal. The orientations increase anticlockwise.
Figure 6
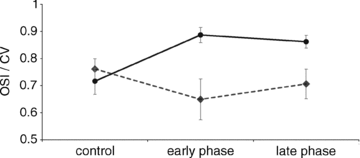
Figure 6. Changes in orientation sensitivity index (OSI) and circular variance (CV) of nine striate cortical cells during the early and late halves of the response window during electrical stimulation, compared to the control orientation sensitivity prior to electrical stimulation
Circles refer to OSI and diamonds to CV. Error bars denote SEM.

Similar articles

Cited by

References

    1. Alonso JM, Usrey WM, Reid RC. Rules of connectivity between geniculate cells and simple cells in cat primary visual cortex. J Neurosci. 2001;21:4002–4015. - PMC - PubMed
    1. Angelucci A, Levitt JB, Walton EJ, Hupe JM, Bullier J, Lund JS. Circuits for local and global signal integration in primary visual cortex. J Neurosci. 2002;22:8633–8646. - PMC - PubMed
    1. Bloomfield SA, Sherman SM. Postsynaptic potentials recorded in neurons of the cat's lateral geniculate nucleus following electrical stimulation of the optic chiasm. J Neurophysiol. 1988;60:1924–1945. - PubMed
    1. Bullier J, Mustari MJ, Henry GH. Receptive-field transformations between LGN neurons and S-cells of cat striate cortex. J Neurophysiol. 1982;47:417–438. - PubMed
    1. Carandini M. Melting the iceberg: contrast invariance in visual cortex. Neuron. 2007;54:11–13. - PubMed

Publication types

LinkOut - more resources