. 2011 May 1;589(Pt 9):2363-81.
doi: 10.1113/jphysiol.2010.200576. Epub 2011 Mar 8.

Structural heterogeneity promotes triggered activity, reflection and arrhythmogenesis in cardiomyocyte monolayers

Affiliations

Structural heterogeneity promotes triggered activity, reflection and arrhythmogenesis in cardiomyocyte monolayers

David S Auerbach et al. J Physiol. .

Abstract

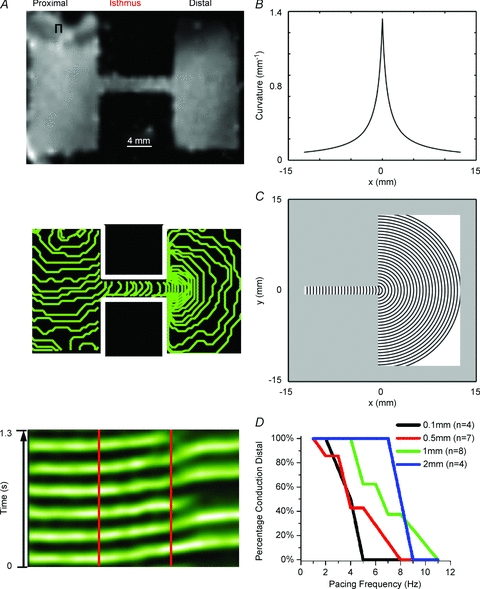
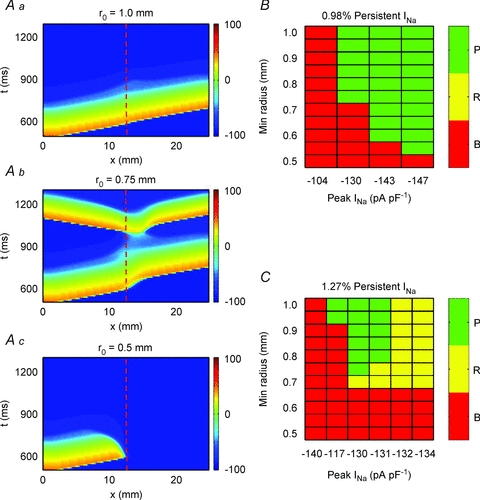
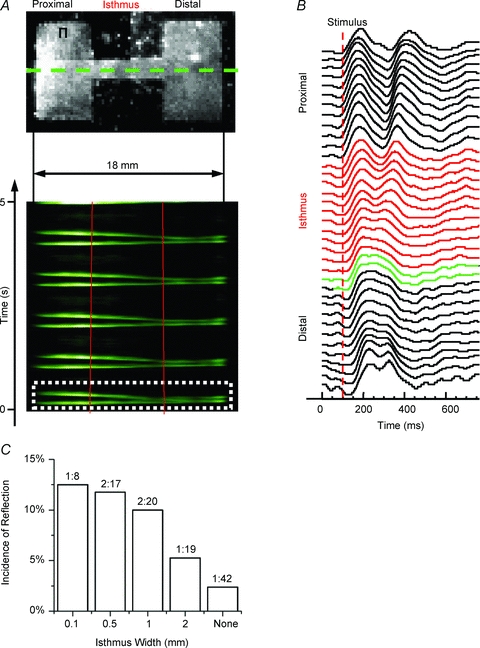
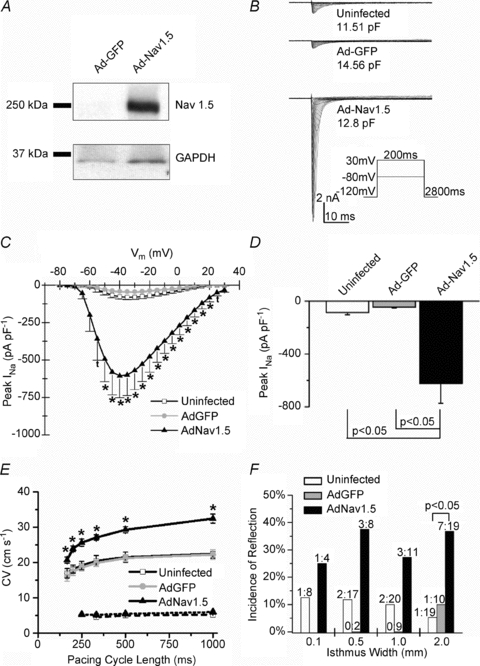
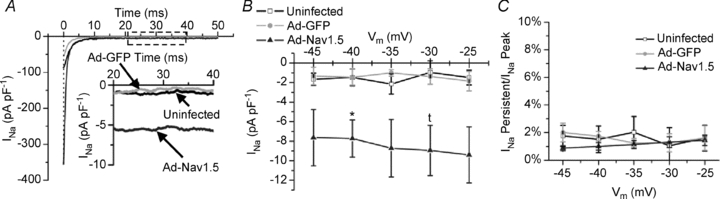
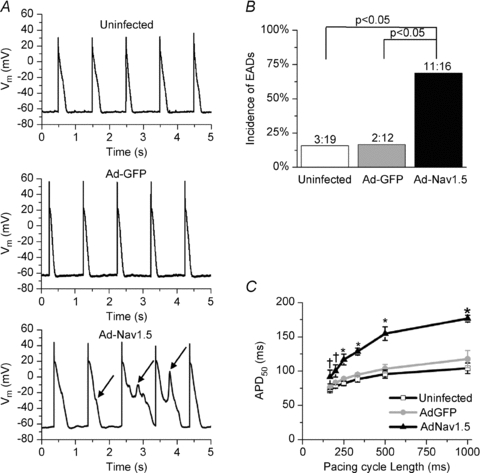
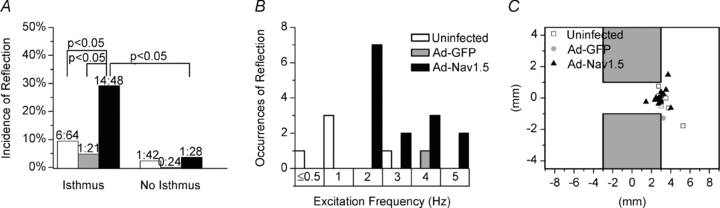
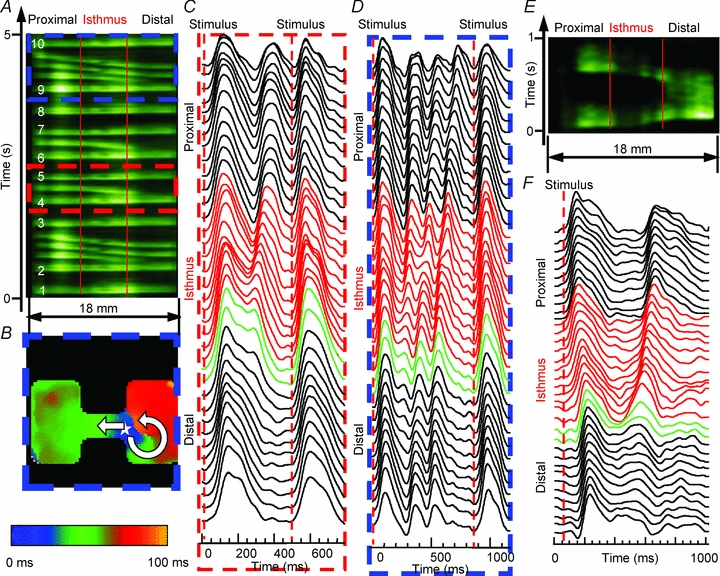
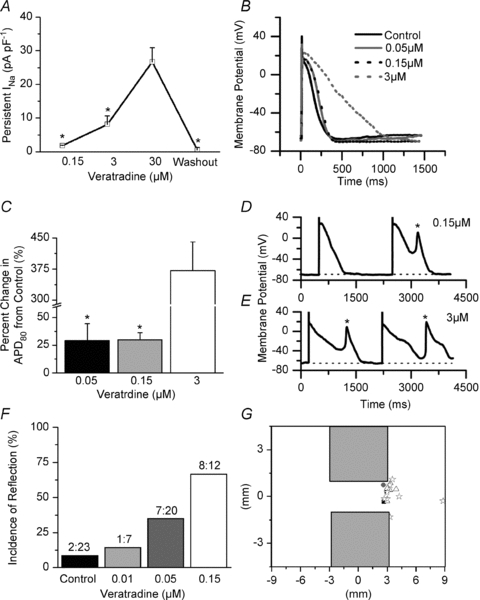
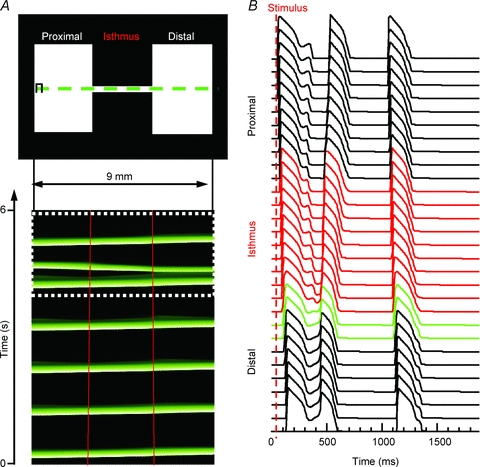
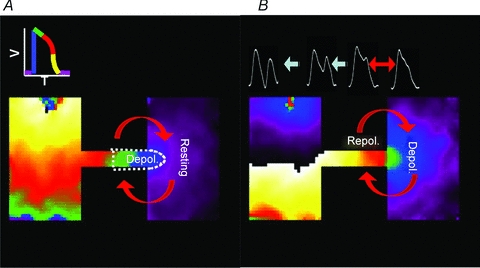
Patients with structural heart disease are predisposed to arrhythmias by incompletely understood mechanisms. We hypothesized that tissue expansions promote source-to-sink mismatch leading to early after-depolarizations (EADs) and reflection of impulses in monolayers of well-polarized neonatal rat ventricular cardiomyocytes.We traced electrical propagation optically in patterned monolayers consisting of two wide regions connected by a thin isthmus.Structural heterogeneities provided a substrate for EADs, retrograde propagation along the same pathway (reflection) and reentry initiation. Reflection always originated during the action potential (AP) plateau at the distal expansion. To determine whether increased sodium current(INa) would promote EADs, we employed adenoviral transfer of Nav1.5 (Ad-Nav1.5). Compared with uninfected and adenoviral expression of green fluorescent protein (Ad-GFP; viral control),Ad-Nav1.5 significantly increased Nav1.5 protein expression, peak and persistent INa density, A Pupstroke velocity, AP duration, conduction velocity and EAD incidence, as well as reflection incidence (29.2%, n =48 vs. uninfected, 9.4%, n =64; and Ad-GFP, 4.8%, n =21). Likewise,the persistent INa agonist veratridine (0.05–3 μM) prolonged the AP, leading to EADs and reflection. Reflection led to functional reentry distally and bigeminal and trigeminal rhythms proximally. Reflection was rare in the absence of structural heterogeneities.Computer simulations demonstrated the importance of persistent INa in triggering reflection and predicted that the gradient between the depolarizing cells at the distal expansion and the repolarizing cells within the isthmus enabled retrograde flow of depolarizing electrotonic current to trigger EADs and reflection. A combination of a substrate (structural heterogeneity) and a trigger (increased persistent INa and EADs) promotes reflection and arrhythmogenesis.


Figures

Figure 1
Figure 1. Excitation frequency dependence of conduction slowing and block at regions of geometrical expansion
A, top panel, uninfected patterned monolayer (1-mm-wide isthmus). A, middle panel, activation map of a patterned NRVM monolayer with a 1-mm-wide isthmus that was paced at 6 Hz, showing 5 ms isochrone lines. A, bottom panel, average time–space plot (TSP) for pixels along horizontal lines that traversed the isthmus from the same preparation when the excitation frequency was increased to 7 Hz (red lines demark the structural heterogeneity). There was conduction slowing at the distal expansion and subsequent conduction block in a 3:2 pattern of conduction to block distally. B, curvature profile along the cable. C, wavefronts (spaced every 0.5 mm) corresponding to the curvature shown in B. There is a 0.75 mm (r0) offset between the location of the highest curvature along the 1D cable (B) and the isthmus–expansion interface in the 2D system (C). This relates to the geometrical properties of the wavefront; the wavefront with the highest curvature (thus the smallest radius, r0) has its right-most point at x0= 0 (according to B) and its centre at x=−r0. D, percentage of the preparations at each isthmus width and pacing frequency that sustained propagation into the distal expansion.
Figure 9
Figure 9. Fate of an impulse arriving at high-curvature region
A, time–space plots illustrating three different fates of an impulse propagating through a high curvature region: propagation (a), reflection (b) and block (c). Red dashed lines denote the expansion (increased curvature). B, fate of the wavefront as a function of peak INa and isthmus half-width at a low level of persistent INa (0.98%). C, fate of the wavefront as a function of peak INa and isthmus half-width at a higher level of persistent INa (1.27%). P, propagation through the region of high curvature; R, reflection at the region of high curvature; B, block at the region of high curvature.
Figure 2
Figure 2. Structural heterogeneities promote reflection
A, top panel, uninfected patterned monolayer (2-mm-wide isthmus) paced at 1 Hz (Π, site of stimulation). A, bottom panel, average TSP for pixels along horizontal lines that traversed the isthmus in A (green dotted line denotes one example). The impulse originates on the upper proximal (left) side and activates the entire preparation distally (right; red lines demark the structural heterogeneity), followed by re-excitation and reflection for each wave. B, optical APs across the preparation for wave 1 (white dotted box in A). Red APs are from pixels within the isthmus and green APs are pixels within the first 500 μm of the distal expansion. C, incidence of reflection at each cable width. Numbers above the bars are the ratio of the number of preparations displaying reflection to the total number of preparations.
Figure 3
Figure 3. Characterization of Ad-Nav1.5 expression
A, representative Ad-Nav1.5 Western blot. Top, Nav1.5 expression; bottom, GAPDH as the loading control. B, representative INa family of traces. C, current–voltage relation of INa. The INa density was significantly larger in the Ad-Nav1.5 group vs. uninfected (t, P < 0.05,) or both uninfected and Ad-GFP (*P < 0.05, N = 6–8, n = 8–12). D, the peak INa density in the Ad-Nav1.5 group. E, conduction velocity (CV) in homogenous NRVM monolayers at various pacing cycle lengths. The CV was significantly faster at all cycle lengths in the Ad-Nav1.5 group vs. uninfected and Ad-GFP groups (*P < 0.05, continuous lines, n = 3–8 monolayers). Upon INa blockade (30 μm TTX), the CV decreased to 4.5–6.0 cm s−1 in all three groups (dotted lines, one-way ANOVA and Tukey's test). F, incidence of reflection for each isthmus width (P < 0.05, χ2 test).
Figure 4
Figure 4. Persistent INa
A, representative traces of TTX-sensitive persistent INa in each group. B, quantification of the persistent INa (N = 2–3, n = 3). C, TTX-sensitive persistent INa normalized to the TTX-sensitive peak INa for each trace as a percentage. One-way ANOVA and Tukey's test.
Figure 5
Figure 5. Expression of Ad-Nav1.5 promotes APD prolongation and EADs
A, representative single-cell current-clamp AP recordings in each group. The AP plateau was prolonged and unstable in the Ad-Nav1.5 group, leading to the frequent occurrence of EADs (arrows). B, incidence of EADs (P < 0.05, χ2 test). C, optical APD at 50% repolarization (APD50) was significantly prolonged at all pacing cycle lengths in the Ad-Nav1.5 group vs. uninfected (†) or both uninfected and Ad-GFP (*); one-way ANOVA and Tukey's test (n = 3–18 monolayers).
Figure 6
Figure 6. Structural and excitation frequency determinants of reflection
A, total incidence of reflection between each group and in the presence vs. absence of an isthmus; χ2 and Fisher's exact test. B, occurrence of reflection at each excitation frequency (rounded to the nearest integer). C, diagram of the monolayer pattern with the site of re-excitation plotted.
Figure 7
Figure 7. Reflection in the Ad-Nav1.5 group
A, average TSP for pixels along horizontal lines that traversed the isthmus from an Ad-Nav1.5 monolayer (2-mm-wide isthmus; red vertical lines demark the structural heterogeneity). Stimulation was at 2 Hz on the proximal (left) side, and the impulse traversed the isthmus and activated the large distal expansion (right), followed by the intermittent occurrence of reflection. Anterograde propagating waves are numbered in white. B, activation map illustrated that re-excitation (star) led to reflection, and a small distal area beneath the expansion was re-excited, which resulted in unidirectional propagation and an anticlockwise rotor. C and D, optical AP recordings during the time period within the red dashed and blue dashed boxes in A, respectively. The red APs are from pixels within the isthmus, and green APs are pixels within the first 500 μm of the distal expansion. E, average TSP from another Ad-Nav1.5 monolayer (0.5-mm-wide isthmus, 3 Hz stimulation) exhibiting reflection. F, optical AP recordings across the preparation in E.
Figure 8
Figure 8. Increased persistent INa promotes EADs and reflection
A, change in persistent INa (veratridine minus control) in single NRVMs (*P < 0.05 vs. 30 μm, n = 3–7). B, representative APs at each dosage of veratridine. C, quantification of percentage increase in the APD80 from control (*P < 0.05 vs. 3 μm, n = 3–9). D and E, representative APs and EADs at 0.15 and 3 μm veratridine (dotted line denotes baseline). F, incidence of reflection at each concentration of veratridine (P = 0.003, χ2 test). G, diagram of the monolayer pattern with the site of re-excitation plotted (black square, control; grey circle, 0.01; white triangle, 0.05 μm; and white star, 0.15 μm). One-way ANOVA and Tukey's test were used in A and C.
Figure 10
Figure 10. Two-dimensional simulations
A, top panel, 2D pattern (9 mm × 4.5 mm). A, bottom panel, time–space plot for pixels along the horizontal line that traversed the isthmus in the top panel. The impulse originates on the proximal (left) side and activates the entire preparation distally (right; red lines demark the structural heterogeneitiy). Following the fifth beat, there was re-excitation at the distal expansion region and a retrograde reflected wave. The final beat propagated through the entire preparation without reflection. B, APs across the preparation for the final two beats (white dotted box in A). The red APs are from nodes within the isthmus, and green APs are pixels within the first 600 μm of the distal expansion.
Figure 11
Figure 11. Schematic representation depicting our explanation for the mechanism of re-excitation and reflection at the isthmus
A, as the depolarizing wavefront (blue) enters the distal expansion there is a strong voltage gradient, and repolarizing electrotonic current flows from the expansion into the isthmus, which leads to conduction slowing and block. B, upon depolarization of the distal region, the voltage gradient is reversed because there is a large area at the depolarized state, while the small area within the isthmus is beginning to repolarize, resulting in APD prolongation at the expansion, and depolarizing electrotonic current flows into the cells within the isthmus, which face a high input impedance and membrane resistance. Consequently, there is re-excitation at the distal expansion, which leads to reflection.

Comment in

  • Expanding on forty years of reflection.
    Tung L. Tung L. J Physiol. 2011 May 1;589(Pt 9):2107-8. doi: 10.1113/jphysiol.2011.209239. J Physiol. 2011. PMID: 21532028 Free PMC article. No abstract available.

Similar articles

Cited by

References

    1. Antzelevitch C. Electrotonic modulation of conduction and automaticity. In: Janse H, Meijler F, Van Der Tweet L, editors. Proceedings of the Royal Academy of Arts and Sciences of the Netherlands. North-Holland, Amsterdam, The Netherlands: 1990.
    1. Antzelevitch C, Jalife J, Moe GK. Characteristics of reflection as a mechanism of reentrant arrhythmias and its relationship to parasystole. Circulation. 1980;61:182–191. - PubMed
    1. Arnestad M, Crotti L, Rognum TO, Insolia R, Pedrazzini M, Ferrandi C, Vege A, Wang DW, Rhodes TE, George AL, Jr, Schwartz PJ. Prevalence of long-QT syndrome gene variants in sudden infant death syndrome. Circulation. 2007;115:361–367. - PubMed
    1. Awad MM, Calkins H, Judge DP. Mechanisms of disease: molecular genetics of arrhythmogenic right ventricular dysplasia/cardiomyopathy. Nat Clin Pract Cardiovasc Med. 2008;5:258–267. - PMC - PubMed
    1. Cabo C, Barr RC. Propagation model using the DiFrancesco-Noble equations. Comparison to reported experimental results. Med Biol Eng Comput. 1992;30:292–302. - PubMed

Publication types

MeSH terms