. 2011 May 15;589(Pt 10):2569-83.
doi: 10.1113/jphysiol.2010.202663. Epub 2011 Mar 8.

Microdomain [Ca²⁺] near ryanodine receptors as reported by L-type Ca²⁺ and Na+/Ca²⁺ exchange currents

Affiliations

Microdomain [Ca²⁺] near ryanodine receptors as reported by L-type Ca²⁺ and Na+/Ca²⁺ exchange currents

Karoly Acsai et al. J Physiol. .

Abstract

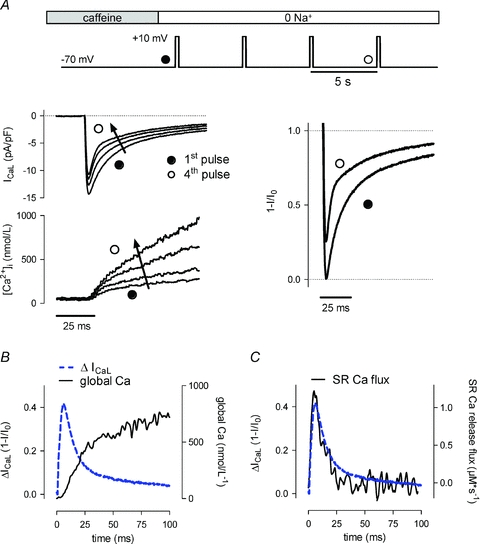
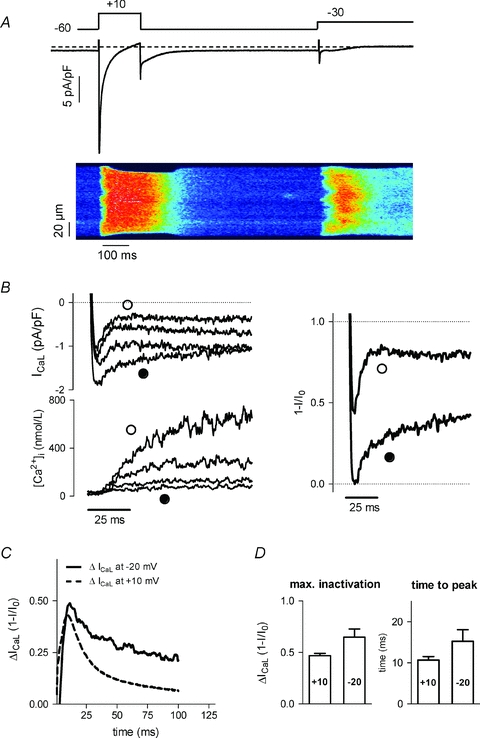
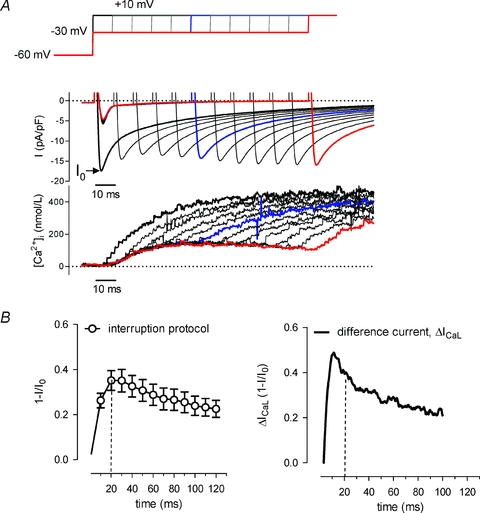
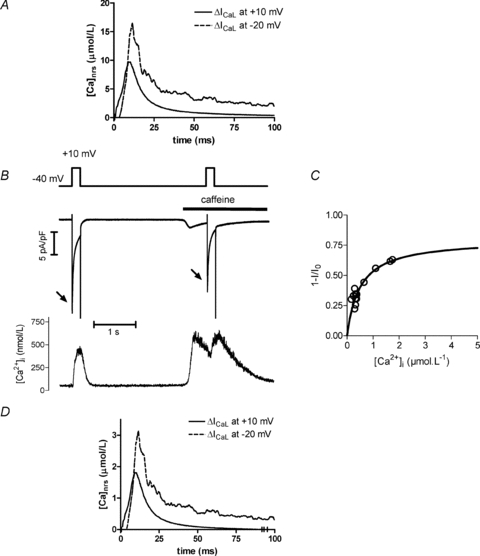
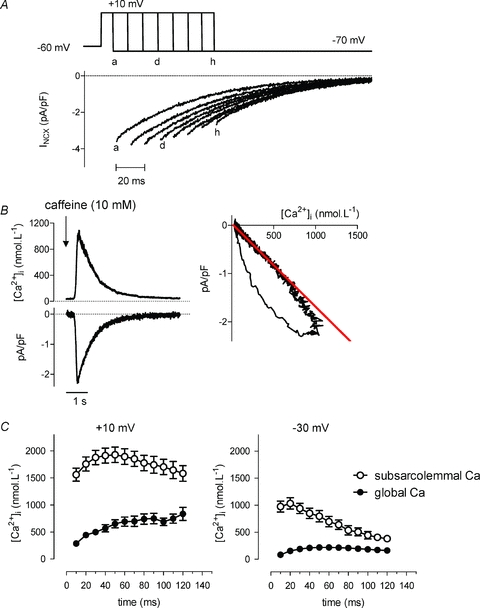
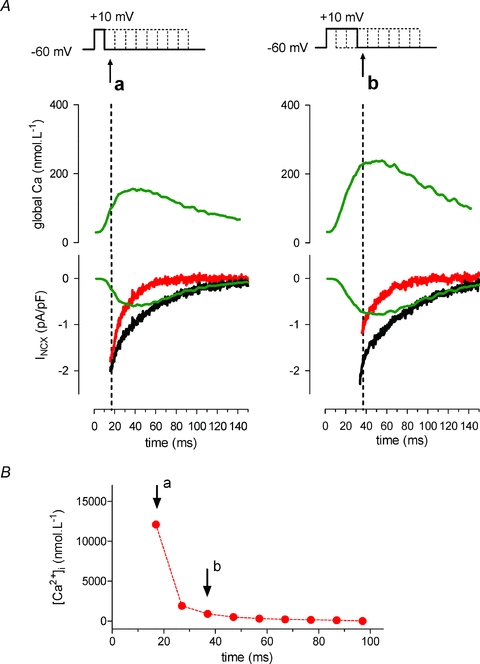
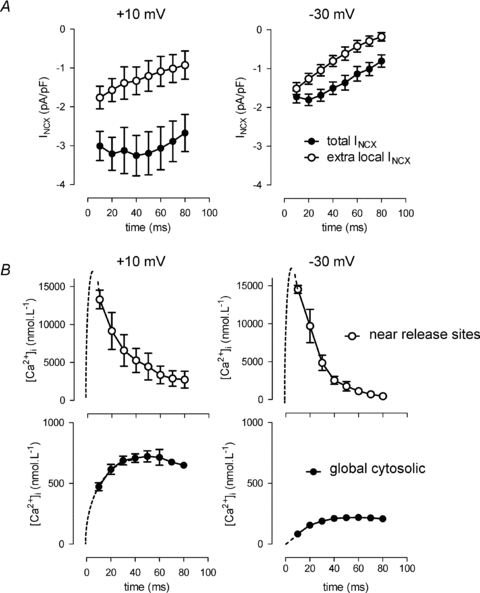
During Ca²⁺ release from the sarcoplasmic reticulum triggered by Ca²⁺ influx through L-type Ca²⁺ channels (LTCCs), [Ca²⁺] near release sites ([Ca²⁺]nrs) temporarily exceeds global cytosolic [Ca²⁺]. [Ca²⁺]nrs can at present not be measured directly but the Na+/Ca2+ exchanger (NCX) near release sites and LTCCs also experience [Ca²⁺]nrs. We have tested the hypothesis that ICaL and INCX could be calibrated to report [Ca²⁺]nrs and would report different time course and values for local [Ca²⁺]. Experiments were performed in pig ventricular myocytes (whole-cell voltage-clamp, Fluo-3 to monitor global cytosolic [Ca²⁺], 37◦C). [Ca²⁺]nrs-dependent inactivation of ICaL during a step to +10 mV peaked around 10 ms. For INCX we computationally isolateda current fraction activated by [Ca²⁺]nrs; values were maximal at 10 ms into depolarization. The recovery of [Ca²⁺]nrs was comparable with both reporters (>90% within 50 ms). Calibration yielded maximal values for [Ca²⁺]nrs between 10 and 15 μmol l⁻¹ with both methods. When applied to a step to less positive potentials (-30 to -20 mV), the time course of [Ca²⁺]nrs was slower but peak values were not very different. In conclusion, both ICaL inactivation and INCX activation, using a subcomponent analysis, can be used to report dynamic changes of [Ca²⁺]nrs. Absolute values obtained by these different methods are within the same range, suggesting that they are reporting on a similar functional compartment near ryanodine receptors. Comparable [Ca²⁺]nrs at +10 mV and -20 mV suggests that, although the number of activated release sites differs at these potentials, local gradients at release sites can reach similar values.


Figures

Figure 1
Figure 1. Extent and time course of inactivation of ICaL related to SR Ca2+ release
A, protocol and typical example of ICaL and Ca2+ transients with increasing SR Ca2+ load. After depletion of SR Ca2+ with caffeine, cells were reloaded by applying repetitive depolarizing pulses to +10 mV in 0 Na+ conditions to prevent Ca2+ removal on NCX. The arrow on ICaL indicates the increasing rate of inactivation of ICaL. Current traces (right) corresponding to a low (filled circle) or large (open circle) amount of SR Ca2+ release are shown after normalization to I0, the first ICaL. B, difference current between normalized traces from A, together with the Ca2+ transient of the fourth pulse. C, difference current superimposed on the SR release flux calculated from the Ca2+ transient of the fourth pulse (see text for details).
Figure 2
Figure 2. ICaL and release-dependent modulation at different levels of depolarization
A, examples of Ca2+ transients in confocal line scan recordings with corresponding ICaL during a step to +10 and −30 mV. B, traces of ICaL, Ca2+ transients and release-dependent inactivation at −20 mV (as in Fig. 1). C, time course of release-dependent inactivation of ICaL at different voltages; averaged traces of difference currents from n = 11 cells at +10 mV and n = 6 cells at −20 mV. D, comparison of maximal inactivation and time to peak of the difference currents recorded at +10 (n = 11) and −20 mV (n = 6).
Figure 3
Figure 3. SR Ca2+ release-dependent inactivation and recovery of ICaL in the presence of Na+/Ca2+ exchange
A, voltage clamp protocol, current recordings and corresponding Ca2+ transients. A step to +10 mV from the holding potential is given to set a reference for maximal availability of LTCCs (peak ICaL is I0, marked by arrow, no inactivation). Subsequently a series of depolarizing steps to −30 mV are applied. Each step is interrupted with a test step to +10 mV at increasing time intervals after the initial depolarization, starting at 10 ms, with increments of 10 ms. With these test steps we measure availability of Ca2+ channels (peak of ICaL, I) and thus the inactivation of LTCCs incurred during the step to −30 mV, compared to the reference, I0; the degree of inactivation is expressed as 1 –I/I0. A test step at 50 ms is marked in blue (1 –I/I0 is 0.21), a step at 100 ms is marked in red (1 –I/I0 is 0.11). B, left panel, mean data obtained with the protocol of panel A for degree of inactivation of LTCCs during a step to −30 mV (n = 8). The right panel repeats the data from Fig. 2C for a step to −20 mV for comparison.
Figure 4
Figure 4. Estimation of [Ca2+]nrs from release-dependent inactivation of ICaL
A, [Ca2+]nrs estimated using the calibration curve for steps to +10 and −20 mV (data from Fig. 2C and using calibration of Hofer et al. (1997)). B, protocol for establishing an intracellular calibration curve. After the first pulse evoking a reference ICaL (I0, no inactivation), 10 mm caffeine was applied to the cell to induce SR Ca2+ release. During the declining phase of the [Ca2+]i transient a test depolarizing pulse was given to record ICaL (I) and estimate Ca2+-dependent inactivation. This was applied with different delays to obtain I at different [Ca2+]. C, Ca2+-dependent inactivation of ICaL plotted against [Ca2+]. Maximal inactivation (M) and Ca2+ causing half-maximal inactivation (Kd) were estimated for individual cells by fitting the equation 1 –I/I0=M× Ca/(Ca +Kd) to the data points. A calibration curve to relate release-dependent inactivation and Ca2+ was constructed using the mean values of M and Kd (0.61 ± 0.025 and 780 ± 67 nm, respectively, n = 10 cells). D, [Ca2+]nrs estimated using the calibration curve for steps to +10 and −20 mV (data from Fig. 2C).
Figure 5
Figure 5. Translating NCX current into [Ca2+]nrs using the global NCX current
A, voltage protocol illustrating how a step to +10 mV is interrupted by repolarization to −70 mV at increasing time intervals, to record the tail NCX currents on repolarization. The letters a, d, and h denote the corresponding repolarization time and currents. The current traces during the depolarization have been omitted for clarity. B, calibration for converting NCX current amplitude to [Ca2+]. Typical recordings of Ca2+ transient and the concomitant inward INCX after application of 10 mm caffeine. A linear relationship (right) between INCX amplitude and Ca2+ was obtained by fitting a line to the declining phase of the caffeine induced Ca2+ transient (intercept 106.5 ± 14.1 nm, slope –0.00194 ± 0.000129 pA pF−1 nm−1, n = 25). C, global Ca2+ transient (filled circles) during SR Ca2+ release and subsarcolemmal Ca2+ (open circles) estimated by using the linear relationship in B for a step to +10 mV (left panel, n = 4), and to −30 mV (right panel, n = 8).
Figure 6
Figure 6. NCX tail current analysis with two compartments to extract [Ca2+]nrs
A, two recordings at 10 ms and at 30 ms into the depolarizing step are shown with the global [Ca2+]i transient and the recorded NCX tail current on repolarization (black current trace). Predicted values for NCX activated by the cytosolic Ca2+ transient are calculated using the NCX model equation of (Weber et al. 2001) (green trace). The difference current between the recorded (black trace) and calculated (green trace) then reflects NCX activated by Ca2+ near release sites and not reported by the cytosolic dye. This measurement is repeated every 10 ms. B, [Ca2+]nrs for during the example depolarizing step to +10 mV as calculated from the values of local NCX current at the corresponding time points.
Figure 7
Figure 7. Time course of [Ca2+]nrs as estimated from the NCX tail currents
A, measured total (filled circles) NCX currents and calculated extra NCX (open circles) at +10 (n = 4) and −30 mV (n = 8). B, calculated [Ca2+]nrs (open circles) and measured global [Ca2+] (filled circles) during steps to +10 (n = 4) and −30 mV (n = 8).

Comment in

  • Measuring calcium in 'fuzzy' spaces.
    Niggli E. Niggli E. J Physiol. 2011 Jun 1;589(Pt 11):2663. doi: 10.1113/jphysiol.2011.210336. J Physiol. 2011. PMID: 21632527 Free PMC article. No abstract available.

Similar articles

Cited by

References

    1. Adachi Akahane S, Cleemann L, Morad M. Cross-signaling between L-type Ca2+ channels and ryanodine receptors in rat ventricular myocytes. J Gen Physiol. 1996;108:435–454. - PMC - PubMed
    1. Altamirano J, Bers DM. Effect of intracellular Ca2+ and action potential duration on L-type Ca2+ channel inactivation and recovery from inactivation in rabbit cardiac myocytes. Am J Physiol Heart Circ Physiol. 2007a;293:H563–H573. - PubMed
    1. Altamirano J, Bers DM. Voltage dependence of cardiac excitation-contraction coupling: unitary Ca2+ current amplitude and open channel probability. Circ Res. 2007b;101:590–597. - PubMed
    1. Antoons G, Mubagwa K, Nevelsteen I, Sipido KR. Mechanisms underlying the frequency dependence of contraction and [Ca2+]i transients in mouse ventricular myocytes. J Physiol. 2002;543:889–898. - PMC - PubMed
    1. Antoons G, Volders PG, Stankovicova T, Bito V, Stengl M, Vos MA, Sipido K. Window Ca2+ current and its modulation by Ca2+ release in hypertrophied cardiac myocytes from dogs with chronic atrioventricular block. J Physiol. 2007;579:147–160. - PMC - PubMed

Publication types

MeSH terms