. 2011 Apr 15;589(Pt 8):1927-41.
doi: 10.1113/jphysiol.2011.206276. Epub 2011 Feb 21.

Loss of olfactory cell adhesion molecule reduces the synchrony of mitral cell activity in olfactory glomeruli

Affiliations

Loss of olfactory cell adhesion molecule reduces the synchrony of mitral cell activity in olfactory glomeruli

Maria Borisovska et al. J Physiol. .

Abstract

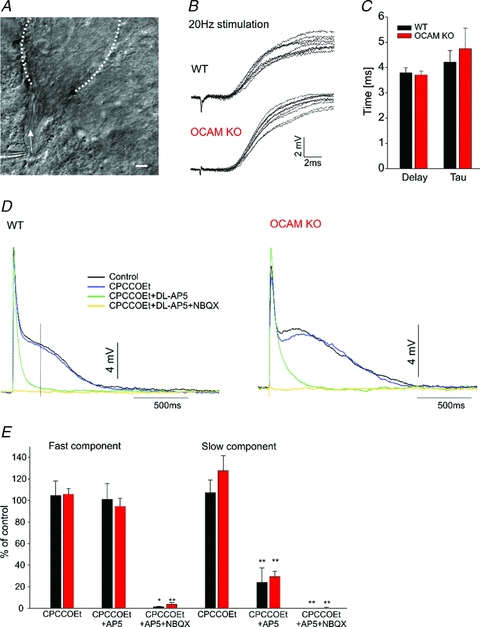
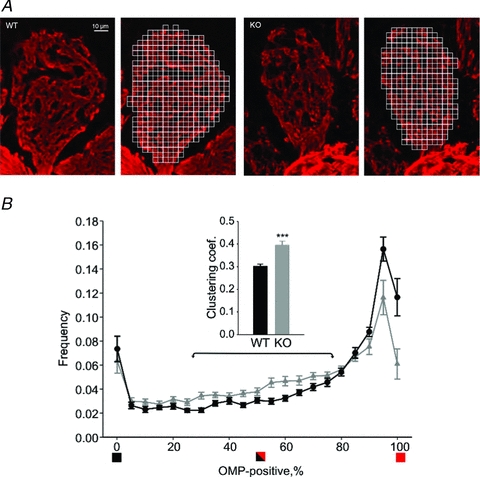
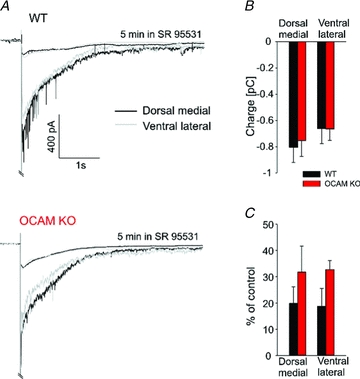
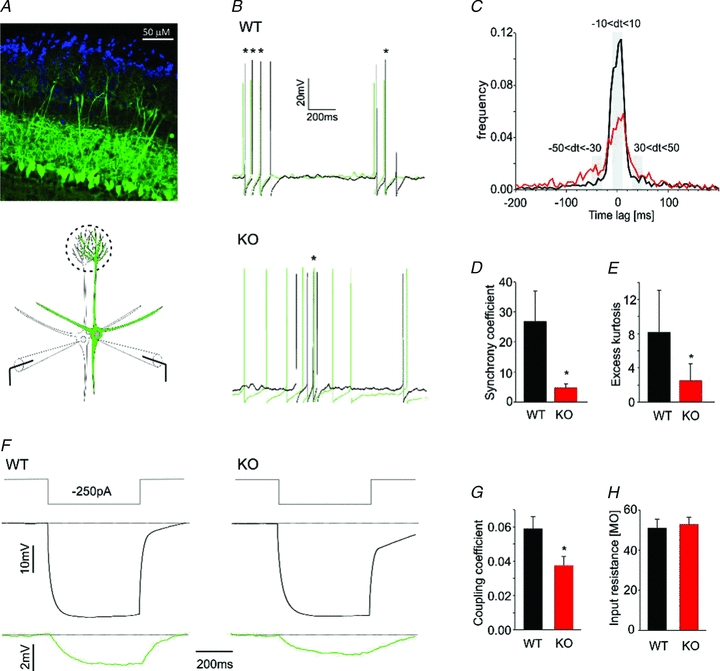
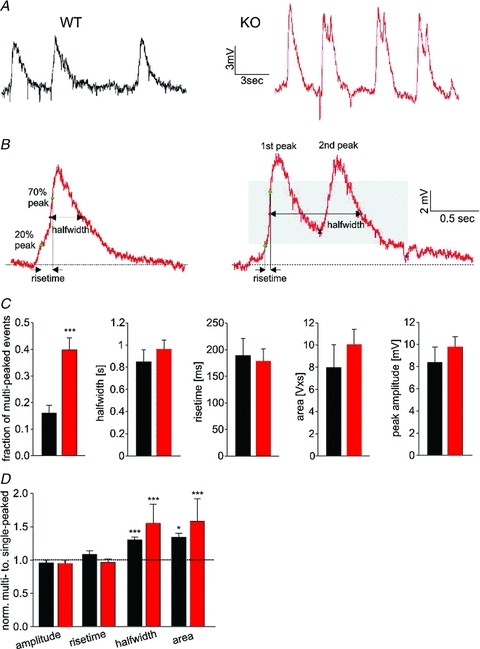
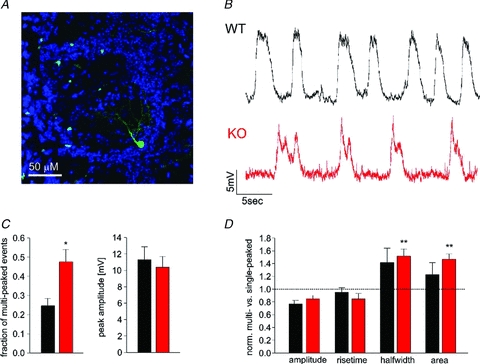
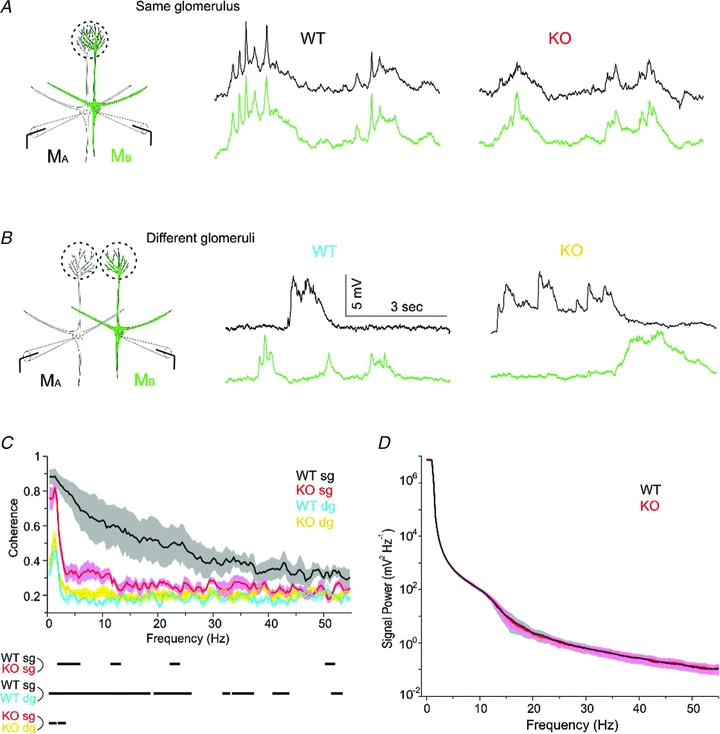
Odours generate activity in olfactory receptor neurons, whose axons contact the dendritic tufts of mitral cells within olfactory bulb glomeruli. These axodendritic synapses are anatomically separated from dendrodendritic synapses within each glomerulus. Mitral cells within a glomerulus show highly synchronized activity as assessed with whole-cell recording from pairs of mitral cells. We examined glomerular activity in mice lacking the olfactory cell adhesion molecule (OCAM). Glomeruli in mice lacking OCAM show a redistribution of synaptic subcompartments, but the total area occupied by axonal inputs was similar to wild-type mice. Stimulation of olfactory nerve bundles showed that excitatory synaptic input to mitral cells as well as dendrodendritic inhibition was unaffected in the knockout. However, correlated spiking in mitral cells was significantly reduced, as was electrical coupling between apical dendrites. To analyse slow network dynamics we induced slow oscillations with a glutamate uptake blocker. Evoked and spontaneous slow oscillations in mitral cells and external tufted cells were broader and had multiple peaks in OCAM knockout mice, indicating that synchrony of slow glomerular activity was also reduced. To assess the degree of shared activity between mitral cells under physiological conditions, we analysed spontaneous sub-threshold voltage oscillations using coherence analysis. Coherent activity was markedly reduced in cells from OCAM knockout mice across a broad range of frequencies consistent with a decrease in tightly time-locked activity. We suggest that synchronous activity within each glomerulus is dependent on segregation of synaptic subcompartments.


Figures

Figure 2
Figure 2. Olfactory nerve evoked EPSPs are unchanged in the OCAM knockouts
A, light microscopy image of theta pipette stimulating olfactory axon bundle (arrow) entering a glomerulus (dashed lines). Scale: 10 μm. B, exemplary recordings of WT (upper panel) and OCAM KO (lower panel) monosynaptic EPSPs stimulated at 20 Hz at high time resolution. Note the stimulation artifact. C, kinetics analysis of the fast component (shown in B) revealed similar time constant (tau) of monoexponential fitting for WT (black, n = 9) and OCAM knockout (red, n = 7). The onset of the monosynaptic EPSP occurred with the same delay. D, exemplary full scale EPSP showed a fast monosynaptic and a slow component in both WT (left panel) and OCAM KO (right panel) mitral cells. The mGluR1 antagonist CPCCOEt (100 μm, blue) has little effect on the EPSP. The NMDA antagonist AP5 (150 μm, green) abolished slow component but did not affect the fast component. Subsequent addition of the AMPA receptor blocker NBQX (20 μm, yellow) completely blocked the EPSP. E, quantification of responses shown in D. The amplitude of the fast component was not affected by CPCCOEt (WT: n = 7, KO: n = 9) or AP5 (WT: n = 6, KO: n = 5). The amplitude of the slow component was measured 250 ms after stimulation. *P < 0.05, **P < 0.01, paired t test.
Figure 1
Figure 1. OCAM disrupts compartmentalization of axonal and dendritic profiles within olfactory bulb glomeruli
A, olfactory bulb glomeruli from wild-type (left) and OCAM knockout (right) were immunostained with an anti-olfactory marker protein (OMP) antibody (red). The labelled areas represent axodendritic subcompartments whereas the unlabelled areas are dendrodendritic subcompartments. We superimposed a grid of 3.5 μm squares (to the right) and calculated the fraction of OPM-positivity within each square. B, the bar graph plots the number of grid squares as a function of the percentage of OMP-labelled area within the square. Wild-type glomeruli showed a large number of grid squares that were completely OMP-positive squares (black circles), whereas the OCAM knockout had squares with a mix of labelled and unlabelled areas (grey triangles). The clustering coefficient as computed for squares in the 25–75% range (arrows) was higher for the knockout. ***P < 0.001. The bar graph shows data from 20 wild-type glomeruli and 19 OCAM knockout glomeruli with 3 animals in each group.
Figure 3
Figure 3
Dendrodendritic inhibition is preserved in the OCAM knockout glomeruli. A Bipolar stimulation of the glomerular layer elicited a long-lasting inward current in mitral cells in wild-type (top) and OCAM knockouts (bottom) in both dorsomedial (black, WT: n = 8, KO: n = 10) and ventrolateral (grey, WT: n = 5, KO: n = 9) regions of the bulb. The responses was strongly diminished by the GABAA receptor antagonist SR 95531 (upper trace), indicating preserved GABAA receptor mediated inhibition from granular and periglomerular cells in the OCAM knockout. Traces represent averages of all recorded cells. B, the overall charge of dendrodendritic inhibition, measured at 3.5 s after the stimulation, was unchanged in OCAM knockouts. C, SR 95531 reduced dendrodendritic inhibition in mitral cells (dorsomedial: WT: n = 8, KO: n = 6; ventrolateral: WT: n = 5, KO: n = 4).
Figure 4
Figure 4. Fast spiking of mitral cells in OCAM knockout is desynchronized
A, confocal image of olfactory bulb horizontal slice from OCAM knockout Thy1-YFP mouse (upper panel). The primary dendrites of mitral cells, labelled with YFP (green), project to their target glomeruli that are surrounded by nuclei of juxtaglomerular cells (DAPI staining, blue). The lower panel shows a schematic drawing of the experimental approach to assess synchronous activity in pairs of mitral cells. B, simultaneous depolarizing current injections into pairs of mitral cells (50–100 pA, 2 s) evoked spikes in current clamp recordings of wild-type (WT, upper panel) and knockout (KO, lower panel). The panel shows superimposed epochs of action potentials in the two cells during the current pulse. In wild-type pairs, action potentials in one cell (green) were closely associated with action potentials in the other cell (black) as indicated by their close spacing. This pattern was much less obvious in the knockout. Asterisks mark lags between action potentials of <20 ms. C, normalized distributions of time lags between action potentials for wild-type (n = 6, black) and knockout (n = 7, red) mitral cell pairs. OCAM knockouts had a lower peak and broader distribution, indicating longer time lags between action potentials. D, spike synchrony was calculated as a probability of time lags less than 20 ms (−10 < dt < 10) divided by probability of time lags of 60–100 ms (−50 < dt < −30 and 30 < dt < 50) as highlighted in grey in C. The synchrony coefficient was 5 times smaller in the knockout. E, the broader distribution in the knockout was confirmed by analysis of excess kurtosis (see methods). *P < 0.05. F and G, to examine electrical coupling between mitral cells in wild-type (left panel) and knockout (right panel), current injection (−250 pA, top panel) into one cell elicited a large hyperpolarization (middle panel) and a small hyperpolarization in the other cell. This electrical coupling was reduced in the knockout (22 and 20 coupling coefficients in 11 and 10 paired recordings from wild-type and knockout respectively). H, the input resistance was the same in wild-type and knockout mitral cells used for measurements of electrical coupling. Even though there was an approximately 30% reduction in coupling coefficients in OCAM knockouts, the lack of change in input resistance was not surprising because gap junctional conductance constitutes only about 20–25% of the total conductance in mitral cells at this age (Maher et al. 2009).
Figure 5
Figure 5. TBOA-induced slow oscillations in mitral cells have altered shape in OCAM knockouts
A, application of the glutamate uptake blocker TBOA evoked ongoing slow oscillations of mitral cells. These slow oscillations originate in the glomerular layer because mitral cells with severed apical dendrites show no oscillations (not shown; Schoppa & Westbrook, 2001). Note the presence of frequent multi-peaked oscillations in the knockout. B, we used the following parameters to analyse the shape of individual events: peak amplitude, area, rise time and half-width. For multi-peaked events, a second peak was considered present if the minimum between peaks occurred in the grey area (right panel, see Methods). C, bar graphs depicting mean values for slow oscillations in wild-type (n = 13, black) and knockout (n = 14, red) mitral cells. There was a 3-fold increase in multi-peaked oscillations in the knockout. Membrane potentials were −63.9 ± 1.9 mV and −63.0 ± 1.5 mV for wild-type and knockout respectively. 76 ± 9 and 70 ± 8 events per cell were analysed for wild-type and knockout, respectively. D, for each cell, the parameters of single- and multi-peaked oscillations were normalized to the average values for single-peaked oscillations. The area and half-width was larger for multi-peaked events in the knockout as well as for the occasional multi-peaked events in wild-type cells (paired t test).
Figure 6
Figure 6. External tufted cells mimic the phenotype of slow oscillations in mitral cells
A, confocal image showing typical external tufted cell (green) in the OCAM knockout, with periglomerular cell body and intraglomerular processes. B, current clamp recordings from an external tufted cell in wild-type (black) and in the knockout (red) show slow oscillations in the presence of TBOA. C, the parameters of the slow oscillations were analysed as in Fig. 3. As for mitral cells, there was an increase in multi-peaked events in OCAM knockout external tufted cells (n = 9, red) compared to controls (n = 8, black). Membrane potential was on −68.5 ± 1.77 mV and −68.62 ± 1.8 mV for wild-type and knockout respectively. 54.5 ± 10.0 and 56.8 ± 5.5 events per cell were analysed for wild-type and knockout, respectively. D, the half-width and area were larger for multi-peaked events in external tufted cells.
Figure 7
Figure 7. Coherence analysis reveals a reduction glomerulus-specific synchrony of mitral cells in OCAM knockouts
We recording spontaneous activity in current clamp recording from pairs of mitral cells A. In cells projecting to the same glomerulus, spontaneous activity in the two cells appeared nearly identical in the wild-type. B, for mitral cells that projected to different glomeruli, there was little overlap in spontaneous activity, indicating that correlated activity originated within the glomerulus. C, to assess the spectral content of the activity, we calculated the coherence in several conditions. The plot shows the coherence (±1 SEM, shaded area) for 4 wild-type pairs projecting to the same glomerulus (WT sg, black), 5 OCAM knockout pairs projecting to the same glomerulus (KO sg, red), 4 wild-type pairs projecting to different glomeruli (WT dg, purple), and 8 knockout pairs projecting to different glomeruli (KO dg, yellow). The dashes below the X-axis indicate frequencies at which the coherence was significantly different across conditions (P < 0.05). D, power spectra were computed for spontaneous activity of mitral cells used in the coherence analysis. There was no different in the spectral content between wild-type (n = 12) and OCAM knockout cells (n = 14). The plot shows the power spectrum ± 1 SEM.

References

    1. Abraham NM, Spors H, Carleton A, Margrie TW, Kuner T, Schaefer AT. Maintaining accuracy at the expense of speed: stimulus similarity defines odor discrimination time in mice. Neuron. 2004;44:865–876. - PubMed
    1. Baker H, Grillo M, Margolis FL. Biochemical and immunocytochemical characterization of olfactory marker protein in the rodent central nervous system. J Comp Neurol. 1989;285:246–261. - PubMed
    1. Bovolin P, Bovetti S, Fasolo A, Katarova Z, Szabo G, Shipley MT, Margolis FL, Puche AC. Developmental regulation of metabotropic glutamate receptor 1 splice variants in olfactory bulb mitral cells. J Neurosci Res. 2009;87:369–379. - PMC - PubMed
    1. Briggman KL, Denk W. Towards neural circuit reconstruction with volume electron microscopy techniques. Curr Opin Neurobiol. 2006;16:562–570. - PubMed
    1. Buck L, Axel R. A novel multigene family may encode odorant receptors: a molecular basis for odor recognition. Cell. 1991;65:175–187. - PubMed

Publication types

MeSH terms

LinkOut - more resources