Randomized Controlled Trial
. 2011 Jun 1;589(Pt 11):2871-85.
doi: 10.1113/jphysiol.2010.204487. Epub 2011 Apr 4.

Human skeletal muscle glycogen utilization in exhaustive exercise: role of subcellular localization and fibre type

Affiliations
Randomized Controlled Trial

Human skeletal muscle glycogen utilization in exhaustive exercise: role of subcellular localization and fibre type

Joachim Nielsen et al. J Physiol. .

Abstract

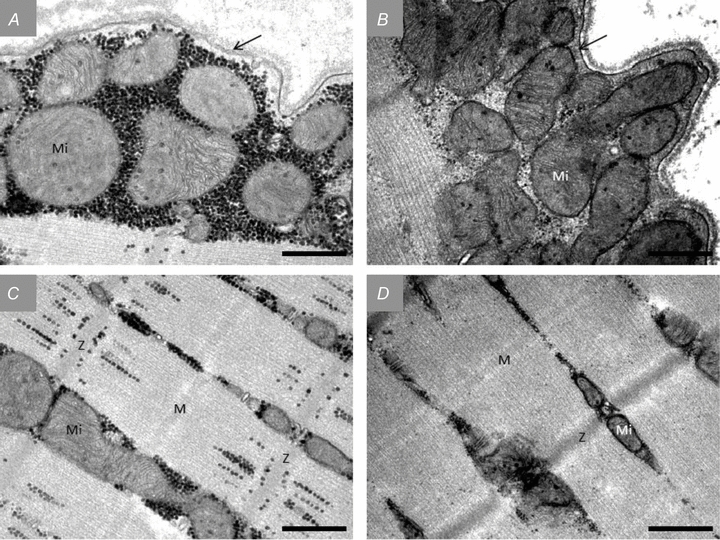
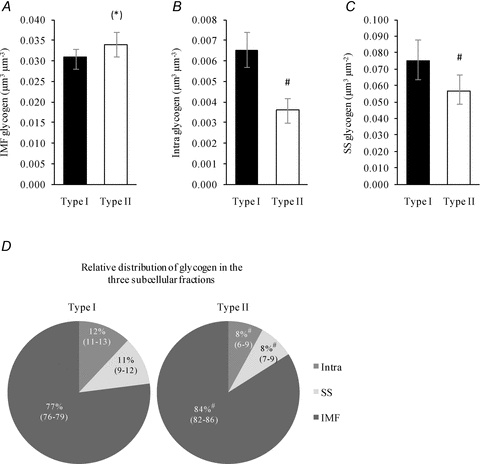
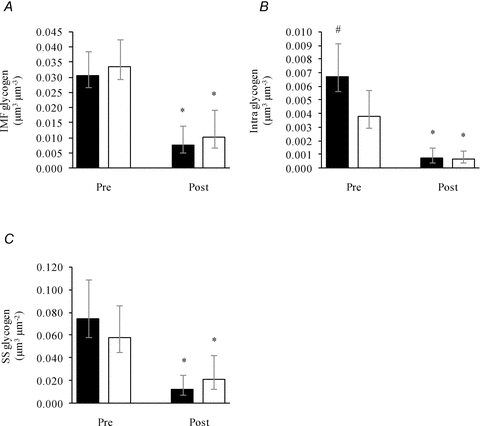
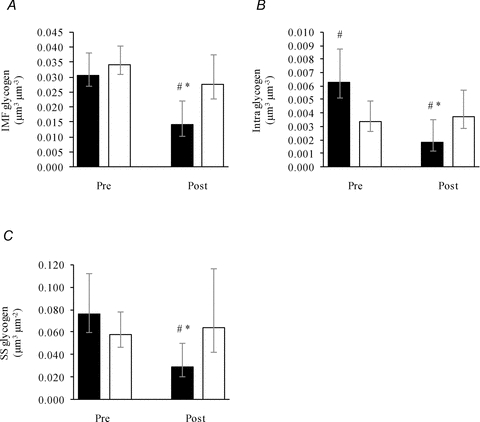
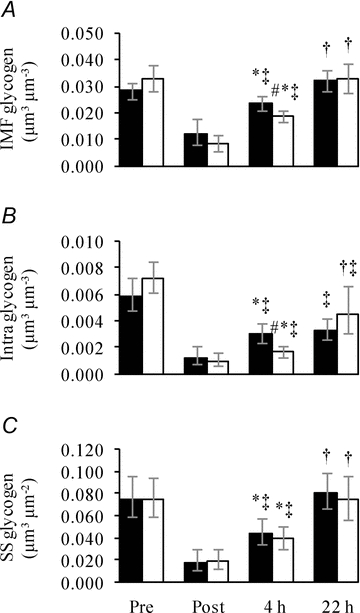
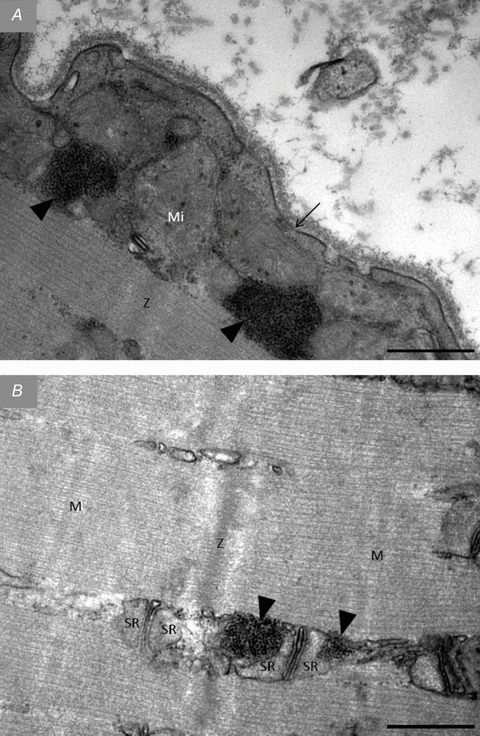
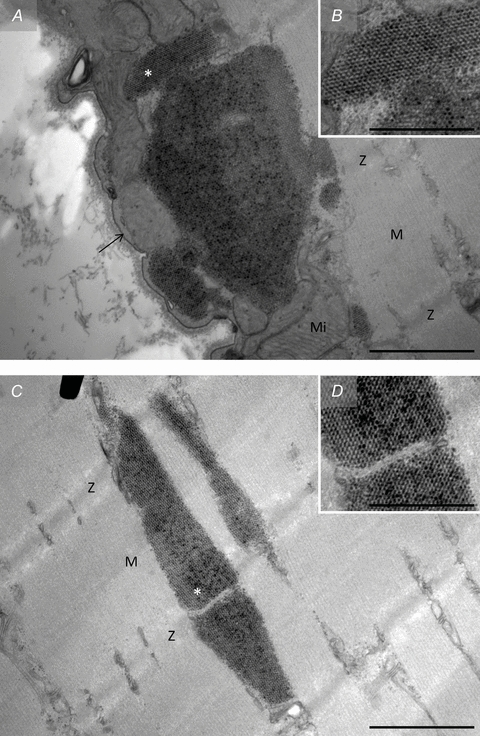
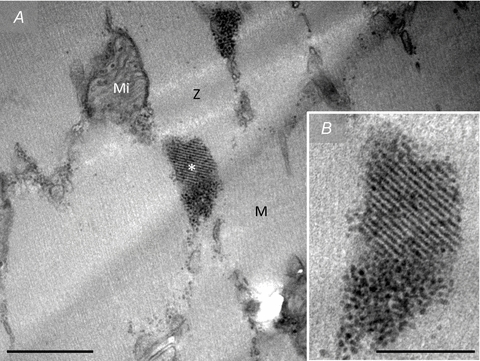
Although glycogen is known to be heterogeneously distributed within skeletal muscle cells, there is presently little information available about the role of fibre types, utilization and resynthesis during and after exercise with respect to glycogen localization. Here, we tested the hypothesis that utilization of glycogen with different subcellular localizations during exhaustive arm and leg exercise differs and examined the influence of fibre type and carbohydrate availability on its subsequent resynthesis. When 10 elite endurance athletes (22 ± 1 years, VO2 max = 68 ± 5 ml kg-1 min-1, mean ± SD) performed one hour of exhaustive arm and leg exercise, transmission electron microscopy revealed more pronounced depletion of intramyofibrillar than of intermyofibrillar and subsarcolemmal glycogen. This phenomenon was the same for type I and II fibres, although at rest prior to exercise, the former contained more intramyofibrillar and subsarcolemmal glycogen than the latter. In highly glycogen-depleted fibres, the remaining small intermyofibrillar and subsarcolemmal glycogen particles were often found to cluster in groupings. In the recovery period, when the athletes received either a carbohydrate-rich meal or only water the impaired resynthesis of glycogen with water alone was associated primarily with intramyofibrillar glycogen. In conclusion, after prolonged high-intensity exercise the depletion of glycogen is dependent on subcellular localization. In addition, the localization of glycogen appears to be influenced by fibre type prior to exercise, as well as carbohydrate availability during the subsequent period of recovery. These findings provide insight into the significance of fibre type-specific compartmentalization of glycogen metabolism in skeletal muscle during exercise and subsequent recovery. .


Figures

Figure 4
Figure 4. Representative TEM images of the subsarcolemmal (A and B) and myofibrillar (C and D) regions pre-exercise (A and C) and post (B and D) approximately 1 h of exhaustive exercise
All images originate from an arm type I fibre. Glycogen is visualized as black dots. Mi, mitochondria; Z, Z-line; M, M-band. The arrows indicate the sarcolemma. Scale bar = 0.5 μm.
Figure 1
Figure 1. Fibre type-specific subcellular localization of glycogen
Type I (n = 59) and II fibres (n = 59) were collected from pre-exercise biopsies of skeletal muscles of the arm (m. triceps brachii) and leg (m. vastus lateralis). A, IMF glycogen. B, Intra glycogen. C, SS glycogen. D, relative amounts of IMF, Intra and SS glycogen. Values are geometric means with 95% confidence intervals (CI). #, P < 0.005 vs. Type I. (*), P = 0.10 vs. Type I.
Figure 2
Figure 2. Glycogen content in three subcellular localizations of arm skeletal muscle (m. triceps brachii) before (Pre) and after (Post) approximately 1 h of exhaustive exercise
Three subfractions of glycogen, IMF (A), Intra (B) and SS (C), were estimated in type I (filled bars, Pre: n = 29, Post: n = 28) and II fibres (open bars, Pre: n = 30, Post: n = 26) pre- and post-exercise. Bars and vertical lines represent geometric means ± 95% CI, respectively. *, P < 0.0001 vs. Pre. #, P < 0.05 vs. type II fibres.
Figure 3
Figure 3. Glycogen content in three subcellular localizations of leg skeletal muscle (m. vastus lateralis) before (Pre) and after (Post) approximately 1 h of exhaustive exercise
Three subfractions of glycogen, IMF (A), Intra (B) and SS (C), were estimated in type I (filled bars, Pre: n = 30, Post: n = 24) and II fibres (open bars, Pre: n = 29, Post: n = 26) pre- and post-exercise. Bars and vertical lines represent geometric means ± 95% CI, respectively. *, P < 0.0001 vs. Pre. #, P < 0.05 vs. type II fibres.
Figure 5
Figure 5. Resynthesis of type I fibre glycogen in three subcellular localizations during recovery, with and without carbohydrate intake, from approximately 1 h of exhaustive exercise
Three subfractions of glycogen, IMF (A), Intra (B) and SS (C), were estimated in type I fibres collected from biopsies obtained before (Pre), immediately after (Post), 4 h after (4 h) and 22 h after (22 h) approximately 1 h of exhaustive exercise. Subjects received either a CHO-rich meal (filled bars) or only water (open bars) during the first 4 h after exercise, after which both groups received CHO-rich meals. Values are geometric means ± 95% CI (n = 23–30). *, P < 0.05 vs. Post. †, P = 0.004 vs. 4 h. ‡, P = 0.03 vs. Pre. #, P = 0.02 vs. CHO group. Differences between time points and groups were tested using Wilcoxon rank-sum test.
Figure 6
Figure 6. TEM images of groupings of glycogen particles observed in fibres post-exercise
In almost all of the most glycogen-depleted fibres post-exercise groupings of small glycogen particles were observed in the subsarcolemmal space (A) and in the intermyofibrillar space in close proximity to sarcoplasmic reticulum (B). Arrow, sarcolemma. Arrow heads, grouping of glycogen particles. Z, Z-line; M, M-band; Mi, mitochondria. SR, sarcoplasmic reticulum. Scale bar = 0.5 μm.
Figure 7
Figure 7. TEM images of crystal-like structures observed in fibres post-exercise
In a few fibres collected from biopsies obtained immediately post-exercise crystal-like structures were observed located both in the subsarcolemmal space (A and B) and in the intermyofibrillar space (C and D). Arrow, sarcolemma. Z, Z-line; M, M-band; Mi, mitochondria. *, position of B and D on A and C, respectively. Scale bar = 1 μm (A and C) or 0.5 μm (B and D).
Figure 8
Figure 8. TEM images of co-localization of groupings of glycogen particles and crystal-like structures observed in fibres post-exercise
Occasionally co-localization of groupings of glycogen particles and crystal-like structures were observed. Z, Z-line; M, M-band; Mi, mitochondria. *, position of B on A. Scale bar = 0.5 μm (A) or 0.2 μm (B).

References

    1. Allen DG, Lamb GD, Westerblad H. Skeletal muscle fatigue: cellular mechanisms. Physiol Rev. 2008;88:287–332. - PubMed
    1. Bangsbo J, Graham TE, Kiens B, Saltin B. Elevated muscle glycogen and anaerobic energy production during exhaustive exercise in man. J Physiol. 1992;451:205–227. - PMC - PubMed
    1. Barnes M, Gibson LM, Stephenson DG. Increased muscle glycogen content is associated with increased capacity to respond to T-system depolarisation in mechanically skinned skeletal muscle fibres from the rat. Pflugers Arch. 2001;442:101–106. - PubMed
    1. Bergström J, Hermansen L, Hultman E, Saltin B. Diet, muscle glycogen and physical performance. Acta Physiol Scand. 1967;71:140–150. - PubMed
    1. Bland JM, Altman DG. Statistical methods for assessing agreement between two methods of clinical measurement. Lancet. 1986;1:307–310. - PubMed

Publication types

MeSH terms