. 2011 May 15;589(Pt 10):2543-58.
doi: 10.1113/jphysiol.2011.207225. Epub 2011 Mar 28.

Population calcium imaging of spontaneous respiratory and novel motor activity in the facial nucleus and ventral brainstem in newborn mice

Affiliations

Population calcium imaging of spontaneous respiratory and novel motor activity in the facial nucleus and ventral brainstem in newborn mice

Karin Persson et al. J Physiol. .

Abstract

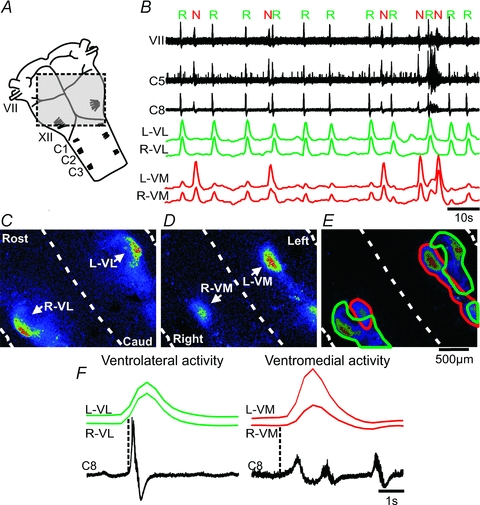
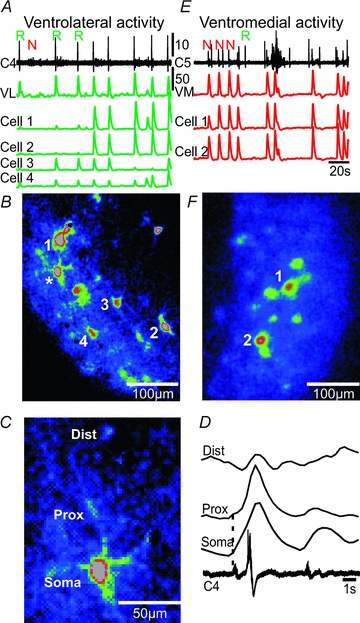
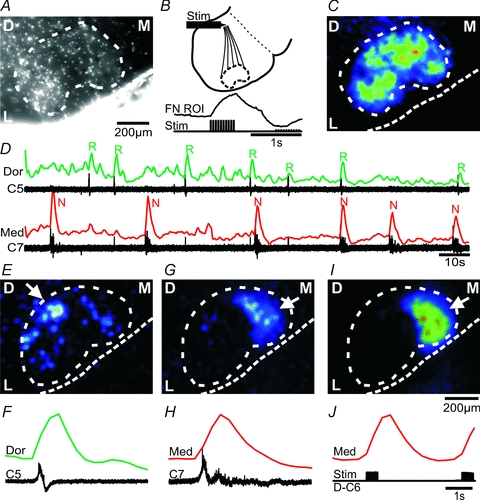
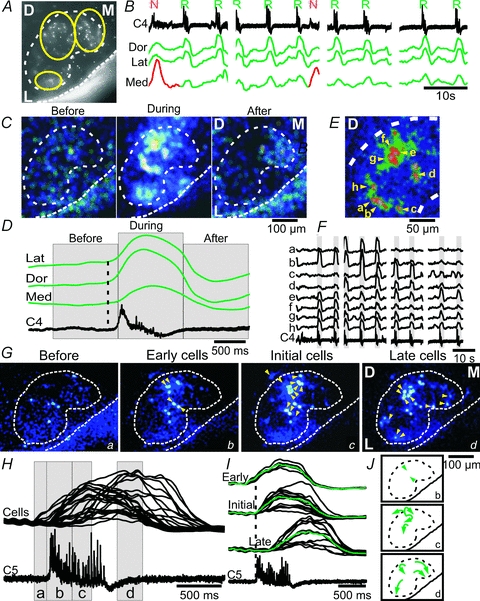
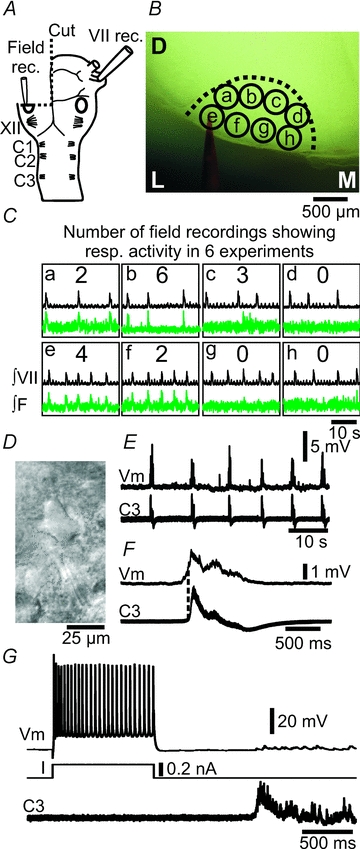
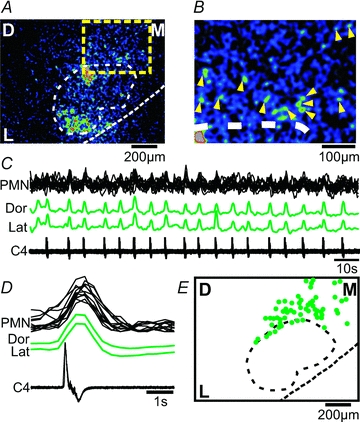
The brainstem contains rhythm and pattern forming circuits, which drive cranial and spinal motor pools to produce respiratory and other motor patterns. Here we used calcium imaging combined with nerve recordings in newborn mice to reveal spontaneous population activity in the ventral brainstem and in the facial nucleus. In Fluo-8AM loaded brainstem-spinal cord preparations, respiratory activity on cervical nerves was synchronized with calcium signals at the ventrolateral brainstem surface. Individual ventrolateral neurons at the level of the parafacial respiratory group showed perfect or partial synchrony with respiratory nerve bursts. In brainstem-spinal cord preparations, cut at the level of the mid-facial nucleus, calcium signals were recorded in the dorsal, lateral and medial facial subnuclei during respiratory activity. Strong activity initiated in the dorsal subnucleus, followed by activity in lateral and medial subnuclei. Whole-cell recordings from facial motoneurons showed weak respiratory drives, and electrical field potential recordings confirmed respiratory drive to particularly the dorsal and lateral subnuclei. Putative facial premotoneurons showed respiratory-related calcium signals, and were predominantly located dorsomedial to the facial nucleus. A novel motor activity on facial, cervical and thoracic nerves was synchronized with calcium signals at the ventromedial brainstem extending from the level of the facial nucleus to the medulla–spinal cord border. Cervical dorsal root stimulation induced similar ventromedial activity. The medial facial subnucleus showed calcium signals synchronized with this novel motor activity on cervical nerves, and cervical dorsal root stimulation induced similar medial facial subnucleus activity. In conclusion, the dorsal and lateral facial subnuclei are strongly respiratory-modulated, and the brainstem contains a novel pattern forming circuit that drives the medial facial subnucleus and cervical motor pools.


Figures

Figure 1
Figure 1. Two different motor patterns on facial and cervical nerve rootlets are synchronized with population activity in the ventrolateral and ventromedial brainstem
A, brainstem–spinal cord preparation illustrating the field-of-view used to image population activity over the ventral surface (shaded area); VII, facial nerve; XII, hypoglossal rootlets; C1, first cervical nerve. B, spontaneous nerve activity recorded from facial (VII) and cervical (C5 and C8) rootlets (left side), and traces showing the ΔF over left, right ventrolateral surface (L,R-VL, green traces), and left, right ventromedial surface (L,R-VM, red traces). Note the regular respiratory activity (R), and irregular novel motor activity (N) in the nerve recordings. C, CTA image triggered off the respiratory nerve activity (16 cycles) showing bilateral population activity along the ventrolateral surface. Rost, rostral; Caud, caudal. Dashed lines demark midline and lateral boundaries of the preparation. D, CTA image triggered off the novel motor nerve activity (7 cycles) showing bilateral population activity along the ventromedial surface. E, overlay of the CTA images from the respiratory and novel motor activity outlining ventrolateral (green), and ventromedial (red) population activities. F, left panel, averages of respiratory nerve activity and ΔF traces from L- and R-VL (16 cycles), Right panel, averages of novel motor nerve activity and ΔF traces from L- and R-VM (7 cycles). Dotted lines indicate onset of nerve activity.
Figure 2
Figure 2. Electrical stimulation of a cervical dorsal root induces population activity at the ventromedial region
A, CTA image triggered off spontaneous novel motor nerve activity (7 cycles) showing bilateral population activity along the ventromedial surface, in particular in rostral and caudal regions. B, spontaneous nerve activity recorded from cervical (C8) rootlet, and traces showing the ΔF over rostral, and caudal regions at the ventromedial surface (red traces). N: novel motor nerve activity. C, averages of novel motor nerve activity (7 cycles) and ΔF traces from rostral and caudal regions (red traces, corresponding to arrows in A). Note that rostral and caudal regions are synchronized. D, CTA image triggered off left cervical dorsal stimulations (D–C7, 7 stimuli), showing bilateral population activity along the ventromedial surface. Note that the stimulus evoked activity is bilateral, and located in the same ventromedial regions as the spontaneous activity in A. E, dorsal root stimulus-evoked ΔF over rostral, and caudal regions at the ventromedial surface (red traces). F, averages of dorsal root stimulus-evoked ΔF (7 cycles) from rostral and caudal regions (red traces, corresponding to arrows in D).
Figure 3
Figure 3. Calcium signals from single neurons at the ventrolateral and ventromedial surface
A, spontaneous respiratory (R) and novel motor (N) nerve activity recorded from cervical (C4) rootlet, and traces showing the ΔF over the ventrolateral surface (VL, green trace), and single neurons (cells 1–4, green traces) at the ventrolateral surface. B, CTA image from the ventrolateral surface triggered off cervical nerve (C4, 8 cycles) showing the location of cells 1–4, and a respiratory-modulated cell (*), which is shown in higher magnification in C. C, single ventrolateral neuron showing dendritic loading of Fluo-8 AM. D, average of ΔF (8 cycles) over the soma, proximal dendrite (Prox) and distal dendrite (Dist), and respiratory activity on the cervical (C4) root. Dotted line indicates onset of somatic ΔF. Note that a calcium signal is present in the proximal and distal dendrite of the neuron. E, spontaneous respiratory (R) and novel motor (N) nerve activity recorded from cervical (C5) rootlet, and traces showing the ΔF over the ventromedial surface (VM), and single neurons (cells 1 and 2, red traces) at the ventromedial surface. F, CTA image from the ventromedial surface triggered off cervical nerve (C5, 9 cycles) showing the location of cells 1 and 2.
Figure 4
Figure 4. Respiratory activity in dorsal, lateral and medial facial subnuclei, and novel motor activity in the medial facial subnucleus
A, average Z-stack-projection of a raw Fluo-8 AM image stack (900 images) from a mid-facial brainstem–spinal cord preparation. D, dorsal; M, medial; L, lateral. Note that the density of facial motoneurons creates an approximate outline (white dotted line) of the facial nucleus. B, diagram illustrating the position (at the internal facial genu) of a stimulating electrode (Stim) used to antidromically activate facial motoneurons. Lower trace, stimulus timing and the resulting ΔF over the facial nucleus (FN ROI). C, CTA image from the facial nucleus triggered off antidromic stimuli (9 stimuli) of the internal facial genu. Calibration bar in A applies to C. D, spontaneous respiratory (R) and novel motor (N) nerve activity recorded from cervical (C5, C7) rootlets, and traces showing the ΔF over the dorsal (Dor, green trace) and medial (Med, red trace) facial subnuclei. E, CTA image from the facial nucleus triggered off respiratory activity on C5 (6 cycles). Note the strong ΔF signal from the dorsal (arrow) and weaker signal from the lateral and medial subnuclei. F, averages of respiratory nerve activity (C5) and ΔF trace from the dorsal (Dor) facial subnucleus. G, CTA image from the facial nucleus triggered off novel motor nerve activity on C7 (6 cycles). H, averages of novel motor nerve activity (C7) and ΔF trace from the medial (Med) facial subnucleus. I, CTA image from the facial nucleus triggered off dorsal root stimulation of the D–C6 (11 stimuli). J, dorsal root stimulus timing, and ΔF trace from the medial (Med) facial subnucleus. Note the strong ΔF signal from the medial subnucleus in G and I (arrow).
Figure 5
Figure 5. Respiratory activity starts in the dorsal facial subnucleus
A, average Z-stack-projection of a raw Fluo-8 AM image stack (4 × 450 images, 2 × 2 binning) from a mid-facial brainstem–spinal cord preparation. D, dorsal; M, medial; L, lateral. Yellow circles define the dorsal, lateral and medial ROIs used for analysis in B–D. B, spontaneous nerve activity recorded from cervical (C4) rootlet, and traces showing the ΔF over the dorsal (Dors), lateral (Lat) and medial (Med) facial subnuclei based on four 70 frames s−1 image sessions. Note the respiratory activity in the dorsal, lateral and medial subnuclei (green traces), and the novel motor activity in the medial subnucleus (red trace). C, CTA images from the facial nucleus triggered off respiratory activity on C4 (9 cycles) in time frames termed ‘Before’ (corresponding to the time in indicated in D), ‘During’ and ‘After’ the respiratory nerve activity. D, averages of respiratory activity (C4) and ΔF traces from the lateral (Lat), dorsal (Dors) and medial (Med) facial subnuclei. Note that the medial subnucleus starts and peaks later than the dorsal and lateral subnuclei (dotted line). E, high magnification CTA image from the dorsal facial nucleus triggered off cervical nerve (C4, 9 cycles) showing the somatic location of eight (a–h) putative facial motoneurons. F, traces showing ΔF from each of the eight neurons in E, along with the C4 respiratory activity. Note that neurons a–d show activity synchronized with some, but not all, respiratory nerve bursts, whereas neurons e–h are synchronized with all respiratory bursts. G, low magnification CTA images from the facial nucleus, with cellular resolution (yellow triangles), in timeframes termed ‘Before’ (corresponding to the time (a) indicated in H), ‘Early cells’ (time b in H), ‘Initial cells’ (time c in H) and ‘Late cells’ (time d in H). H, overlaid ΔF traces from cells shown in G, in relation to a single respiratory burst on C5. I, sorted traces showing ΔF from Early, Initial and Late cells, and the resulting average (green traces), in relation to a single respiratory burst on C5. J, schematic diagram showing the dorsal start of respiratory activity, and subsequent spread to lateral and medial facial subnuclei.
Figure 6
Figure 6. Respiratory activity is strongest in the dorsal part of the facial nucleus in the sagittal plane
A, CTA image from the respiratory column and facial nucleus captured in the sagittal plane triggered off respiratory activity on C4 (19 cycles). D, dorsal; V, ventral; C, caudal; R, rostral. Yellow squares define four ROIs used for the analysis in B. Note the strong ΔF signal from the dorsal (ROI-3) and weaker signal from the ventral part of the facial nucleus (ROI-4). B, averages of respiratory nerve activity (XII, C4, black traces) and ΔF (green traces) from the caudal and rostral respiratory column (lines 1 and 2), and dorsal and ventral part of the facial nucleus (lines 3 and 4). Note that the peak dorsal ΔF signal (line 3) is larger than the peak ventral ΔF signal.
Figure 7
Figure 7. Electrical field potential recordings from the facial nucleus show respiratory activity in dorsal and lateral subnuclei
A, brainstem–spinal cord preparation, with one-side transverse cut through the mid-facial nucleus (oval), illustrating the position of nerve and field potential recording pipettes. VII, facial nerve; XII, hypoglossal rootlets; C1, first cervical nerve. B, photomicrograph of the live preparation, indicating the outline of the facial nucleus, eight recording positions (a–h), and the field potential recording pipette (labelled with red dye). D, dorsal; L, lateral; M, medial. C, integrated facial nerve, and field potential recordings (green traces) from positions a–h within the facial nucleus (∫VII, ∫F). Numbers in the middle of each box indicate the number of field potential recordings showing respiratory activity in 6 experiments. Note that the dorsal and lateral positions show respiratory field potential activity. D, contrast enhanced video micrograph of facial motoneuron. E, whole-cell patch recording of weak inspiratory drive potentials in a facial motoneuron (Vm), along with respiratory nerve activity on C3. F, cycle triggered average (6 cycles) of the membrane potential (Vm) and C3 activity from E. Dotted line indicates onset of nerve activity. G, firing pattern of a facial motoneuron in response to current (I) input, a single respiratory nerve burst on C3 and the resulting small inspiratory burst potential.
Figure 8
Figure 8. Putative facial premotoneurons, located dorsomedial to the facial nucleus, show respiratory activity
A, CTA image from the facial nucleus triggered off respiratory activity on C4 (18 cycles) showing respiratory activity in the dorsal and lateral facial subnuclei, but also in cells located outside the facial nucleus (yellow square). B, zoom in of the yellow square region from A, showing individual cells (yellow triangles). C, respiratory activity on C4 and ΔF traces from the dorsal (Dor) and lateral (Lat) facial nucleus, and from individual premotoneurons (PMN, black overlaid traces). D, averages of respiratory activity (C4) and ΔF traces from 12 PMNs located dorsomedially to the facial nucleus. E, cumulated location of facial premotoneurons (green filled circles) showing respiratory activity (from 8 preparations). Note the predominantly dorsomedial positions of respiratory-modulated facial premotoneurons.

Similar articles

Cited by

References

    1. Ashwell KW. The adult mouse facial nerve nucleus: morphology and musculotopic organization. J Anat. 1982;135:531–538. - PMC - PubMed
    1. Bosma MM. Timing and mechanism of a window of spontaneous activity in embryonic mouse hindbrain development. Ann N Y Acad Sci. 2010;1198:182–191. - PubMed
    1. Bouvier J, Thoby-Brisson M, Renier N, Dubreuil V, Ericson J, Champagnat J, Pierani A, Chedotal A, Fortin G. Hindbrain interneurons and axon guidance signalling critical for breathing. Nat Neurosci. 2010;13:1066–1074. - PubMed
    1. Bystrzycka EK, Nail BS. The source of the respiratory drive to nasolabialis motoneurones in the rabbit; a HRP study. Brain Res. 1983;266:183–191. - PubMed
    1. Dauvergne C, Pinganaud G, Buisseret P, Buisseret-Delmas C, Zerari-Mailly F. Reticular premotor neurons projecting to both facial and hypoglossal nuclei receive trigeminal afferents in rats. Neurosci Lett. 2001;311:109–112. - PubMed

Publication types

LinkOut - more resources