. 2011 Jun;156(2):856-72.
doi: 10.1104/pp.111.174334. Epub 2011 Apr 12.

The Bphi008a gene interacts with the ethylene pathway and transcriptionally regulates MAPK genes in the response of rice to brown planthopper feeding

Affiliations

The Bphi008a gene interacts with the ethylene pathway and transcriptionally regulates MAPK genes in the response of rice to brown planthopper feeding

Jing Hu et al. Plant Physiol. 2011 Jun.

Abstract

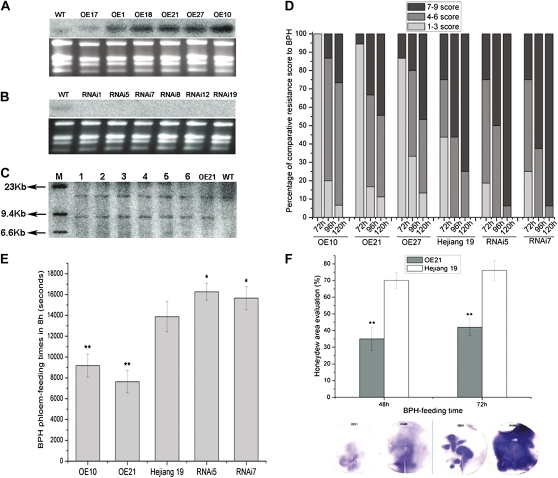
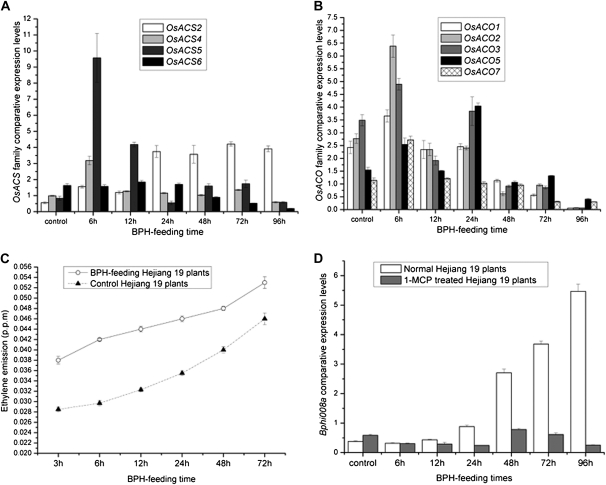
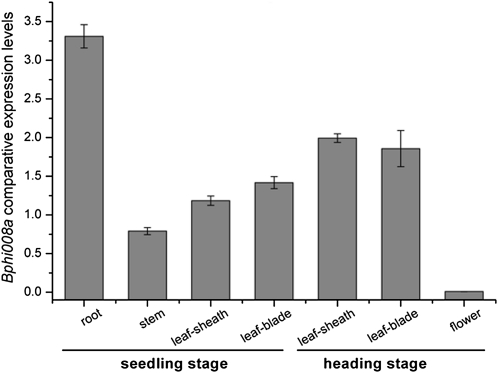
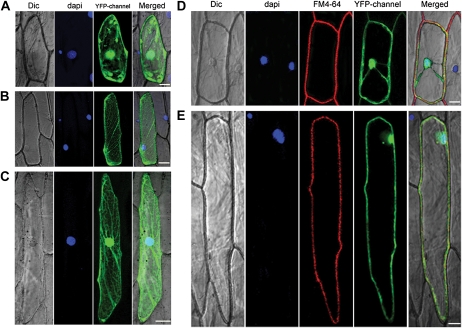
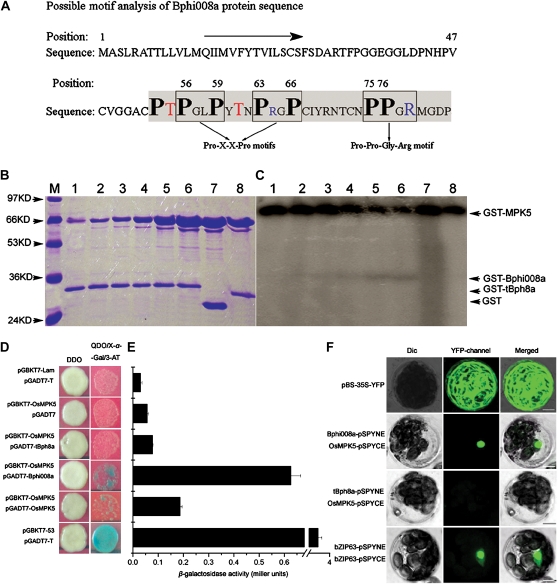
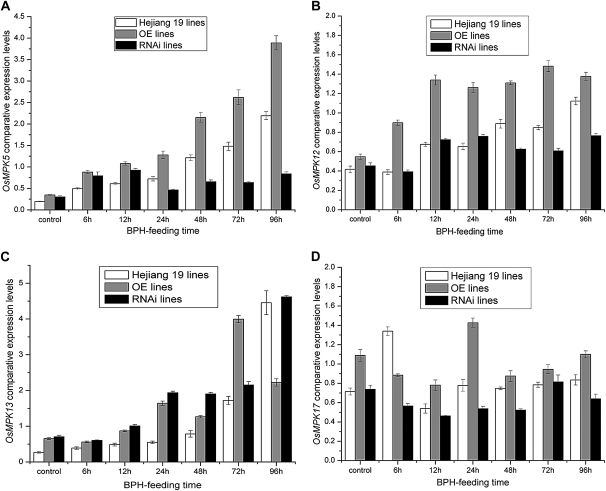
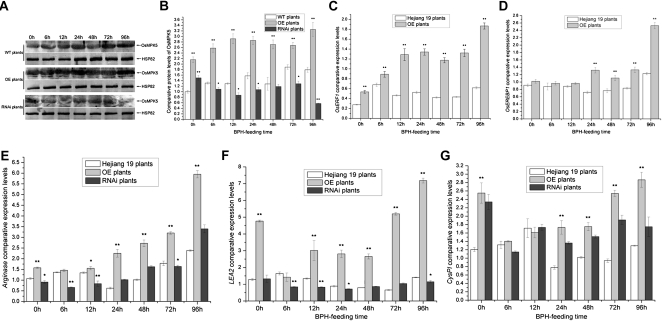
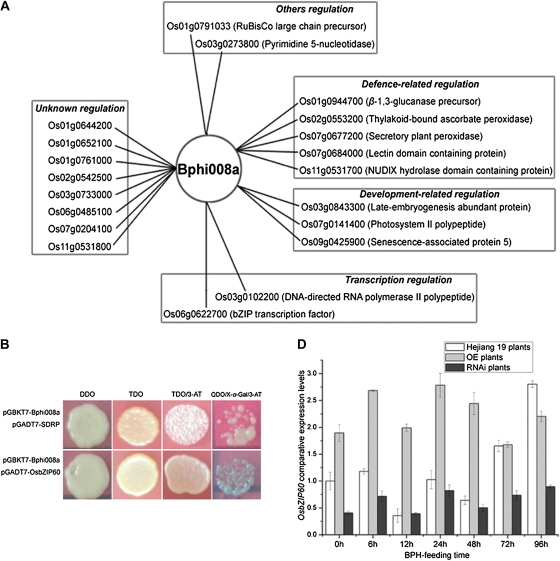
We examined ways in which the Brown planthopper induced008a (Bphi008a; AY256682) gene of rice (Oryza sativa) enhances the plant's resistance to a specialist herbivore, the brown planthopper (BPH; Nilaparvata lugens). Measurement of the expression levels of ethylene synthases and of ethylene emissions showed that BPH feeding rapidly initiated the ethylene signaling pathway and up-regulated Bphi008a transcript levels after 6 to 96 h of feeding. In contrast, blocking ethylene transduction (using 1-methylcyclopropene) reduced Bphi008a transcript levels in wild-type plants fed upon by BPH. In vitro kinase assays showed that Bphi008a can be phosphorylated by rice Mitogen-activated Protein Kinase5 (OsMPK5), and yeast two-hybrid assays demonstrated that the carboxyl-terminal proline-rich region of Bphi008a interacts directly with this kinase. Furthermore, bimolecular fluorescence complementation assays showed that this interaction occurs in the nucleus. Subsequently, we found that Bphi008a up-regulation and down-regulation were accompanied by different changes in transcription levels of OsMPK5, OsMPK12, OsMPK13, and OsMPK17 in transgenic plants. Immunoblot analysis also showed that the OsMPK5 protein level increased in overexpressing plants and decreased in RNA interference plants after BPH feeding. In transgenic lines, changes in the expression levels of several enzymes that are important components of the defenses against the BPH were also observed. Finally, yeast two-hybrid screening results showed that Bphi008a is able to interact with a b-ZIP transcription factor (OsbZIP60) and a RNA polymerase polypeptide (SDRP).


Figures

Figure 1.
Figure 1.
Northern- and Southern-blot analysis of Bphi008a in wild-type and transgenic plants, and evaluation of its contribution to resistance to the BPH. A, Bphi008a expression levels in normal wild-type (WT) and six T0 OE plants. OE17 was a three-copy insertion plant, OE10 was a two-copy insertion plant, and the rest were one-copy insertion plants. B, Bphi008a expression levels in normal wild-type and six T0 RNAi plants after the BPH had been feeding for 48 h. C, Southern-blot analysis of OE21 T2 progeny. Lanes 1 to 6, Samples from six randomly chosen T2 plants; lane M, λDNA/HindIII marker. D, Evaluation of resistance to the BPH. Fifty plants of each line were chosen for analysis of percentage of severity score to BPH after the BPH had been feeding for 72, 96, and 120 h. Five independent experiments were performed with similar results, and the results of one representative experiment are shown. E, Electronic penetration graph evaluation of BPH phloem-feeding times on OE10, OE21, wild-type, RNAi5, and RNAi7 plants. Each bar represents the mean time ± se of five replicates. F, Honeydew area evaluation after the BPH had been feeding for 48 and 72 h on OE21 and wild-type plants. The size of the honeydew area and the intensity of the honeydew color indicate the BPH feeding activity. Standard bars indicate mean values from eight replicates. Significant differences in E and F are indicated with asterisks (* P < 0.05, ** P < 0.01, by Student’s t test). [See online article for color version of this figure.]
Figure 2.
Figure 2.
Determination of the optimal numbers of control genes for normalization. Average expression stability values (M) of the remaining HK genes during stepwise exclusion of the least stably expressed HK gene in leaf sheath cDNA samples after BPH feeding for 0, 6, 12, 24, 48, 72, and 96 h. A, HK gene stability evaluation and choice in wild-type lines. B, HK gene stability evaluation and choice in OE and control wild-type lines. C, HK gene stability evaluation and choice in RNAi and control wild-type lines. D, HK gene stability evaluation and choice in 1-MCP-treated wild-type and control wild-type lines. E, Pairwise variation (Vn/n + 1) analysis between the normalization factors NFn and NFn + 1 to determine the number of control genes required for accurate normalization in our study. This experiment was repeated with two biological replicates, and we obtained the same results.
Figure 3.
Figure 3.
Bphi008a is a downstream gene of the Et signaling pathway. A and B, Comparative expression levels of members of the OsACS and OsACO family after BPH feeding for between 0 and 96 h on wild-type plants. C, Profiles of Et emissions from wild-type plants after BPH feeding for between 3 and 72 h. Values shown are means ± sd based on three independent experiments. The experiment was repeated two times with similar results. D, Bphi008a expression patterns with and without 1-MCP treatment in response to BPH feeding from 0 to 96 h on Hejiang 19 plants.
Figure 4.
Figure 4.
Bphi008a expression patterns in rice from the seedling and heading stages. The HK gene used for normalization in this study was LSD1.
Figure 5.
Figure 5.
Subcellular localization of Bphi008a, tnBph8a, and OsMPK5. A, YFP protein localization in onion epidermal cells. B and C, YFP-tnBph8a fusion protein localization in onion epidermal cells. D, Dual YFP-Bphi008a protein localization in onion epidermal cells. E, Dual YFP-OsMPK5 protein localization in onion epidermal cells. Dic, Differential interference contrast. Bar = 50 μm.
Figure 6.
Figure 6.
Bphi008a interacts with OsMPK5 in vitro and in vivo. A, Possible motifs of the Bphi008a protein. Enclosed squares are two possible Pro-X-X-Pro motifs and one Pro-Pro-Gly-Arg motif. Bold black letters represent Pro residues in possible motifs; red letters represent possible Thr phosphorylated sites before the Pro-X-X-Pro motifs; blue letters represent positively charged Arg in motifs. The shaded region of the C terminus was also cleaved, and the remaining region was used as a negative control. B and C, Phosphorylation of the Bphi008a by OsMPK5 in vitro. Lanes 1 to 6, Kinase activities obtained from incubating 3 μg of GST-Bphi008a protein with 0.5, 1, 2, 4, 8, and 16 μg of GST-OsMPK5 protein, respectively, in an in vitro assay; lanes 7 and 8, kinase activities obtained from incubating 3 μg of GST and GST-tBph8a protein, respectively, with 16 μg of GST-OsMPK5 protein in an in vitro assay; lane M, protein masses in kD. D, Yeast two-hybrid assay of the interaction between Bphi008a or tBph8a and OsMPK5. The diploids were grown on DDO plates and transferred to QDO/X-α-Gal/3-amino-1,2,4-triazole (3-AT) plates with 20 μg mL−1 X-α-Gal and 10 μm 3-AT for 3 d. E, Relative β-galactosidase activities obtained were consistent with the results observed on QDO/X-α-Gal/3-AT plates. F, BiFC visualization of the Bphi008a-OsMPK5 and tBph8a-OsMPK5 interaction in transiently coexpressed Arabidopsis mesophyll protoplasts. The pBS-35S-YFP vector served as a transfected control, and the Arabidopsis nuclear protein bZIP63 served as a BiFC positive control. Dic, Differential interference contrast. Bars = 10 μm.
Figure 7.
Figure 7.
OsMPK5, OsMPK12, OsMPK13, and OsMPK17 expression patterns in transgenic and wild-type plants after the BPH had been feeding for between 0 and 96 h. Corresponding Bphi008a expression levels in transgenic and wild-type plants are shown in Supplemental Figure S4.
Figure 8.
Figure 8.
A, Immunoblot analysis of OsMPK5 in transgenic and wild-type (WT) plants after the BPH had been feeding for between 0 and 96 h. Protein (50 μg) was separated by SDS-PAGE, electroblotted, and probed with rabbit OsMPK5 polyclonal antibody (1:1,000). After incubation with goat anti-rabbit IgG (1:10,000) conjugated to alkaline phosphatase, the complex was visualized using 5-bromo-4-chloro-3-indolyl phosphate/nitroblue tetrazolium solution. Rice HSP82 (Q69QQ6) mouse monoclonal antibody (1:10,000) was used as a loading control. B, Comparative protein levels of OsMPK5 in wild-type and transgenic plants from three replicates. The western-blot signals of OsMPK5 were analyzed with Quantity One (Bio-Rad) and are shown with a histogram. C to G, Comparative expression levels of OsERF1, OsEREBP1, Arginase, LEA2, and CysPI after the BPH had been feeding for between 0 and 96 h in wild-type and transgenic plants. Each bar represents the mean value ± se of three replicates. Significant differences in B to G are indicated with asterisks (* P < 0.05, ** P < 0.01, by Student’s t test).
Figure 9.
Figure 9.
Bphi008a-interacting proteins identified by yeast two-hybrid screening and its interaction with OsbZIP60 or SDRP in vivo. A, Bphi008a-interacting proteins identified by yeast two-hybrid screening. The Bphi008a-interacting proteins were classified into five categories (as indicated in boxes) based on their putative functions. B, Yeast two-hybrid assay of the interaction between Bphi008a and OsbZIP60 or SDRP. TDO/3-AT, Plates containing 5 mm 3-AT; QDO/X-α-Gal/3-AT, plates containing 10 mm 3-AT and 20 μg mL−1 X-α-Gal. C, Comparative expression levels of OsbZIP60 after the BPH had been feeding for between 0 and 96 h in wild-type and transgenic plants.

References

    1. Andersen CL, Jensen JL, Ørntoft TF. (2004) Normalization of real-time quantitative reverse transcription-PCR data: a model-based variance estimation approach to identify genes suited for normalization, applied to bladder and colon cancer data sets. Cancer Res 64: 5245–5250 - PubMed
    1. Asai T, Tena G, Plotnikova J, Willmann MR, Chiu WL, Gomez-Gomez L, Boller T, Ausubel FM, Sheen J. (2002) MAP kinase signalling cascade in Arabidopsis innate immunity. Nature 415: 977–983 - PubMed
    1. Ausubel FM. (2005) Are innate immune signaling pathways in plants and animals conserved? Nat Immunol 6: 973–979 - PubMed
    1. Baldwin IT, Kessler A, Halitschke R. (2002) Volatile signaling in plant-plant-herbivore interactions: what is real? Curr Opin Plant Biol 5: 351–354 - PubMed
    1. Berrocal-Lobo M, Molina A, Solano R. (2002) Constitutive expression of ETHYLENE-RESPONSE-FACTOR1 in Arabidopsis confers resistance to several necrotrophic fungi. Plant J 29: 23–32 - PubMed

Publication types

MeSH terms

LinkOut - more resources