Comparative Study
. 2012 Apr;34(2):479-95.
doi: 10.1007/s11357-011-9240-6. Epub 2011 Apr 13.

Relationship between functional ability in older people, immune system status, and intensity of response to CMV

Affiliations
Comparative Study

Relationship between functional ability in older people, immune system status, and intensity of response to CMV

Marco Antonio Moro-García et al. Age (Dordr). 2012 Apr.

Abstract

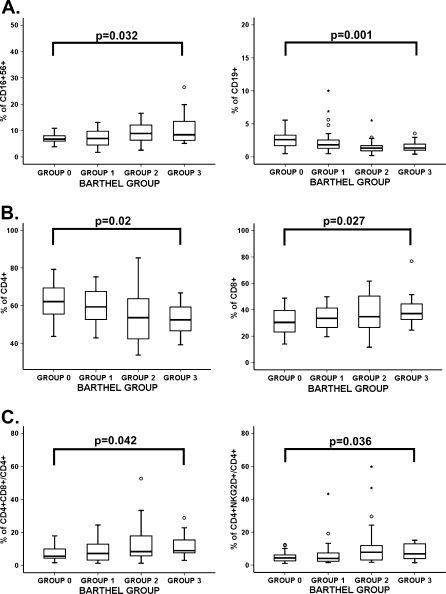
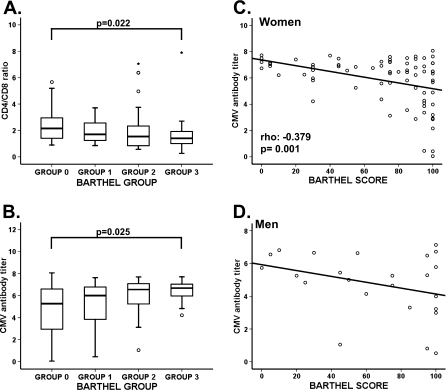
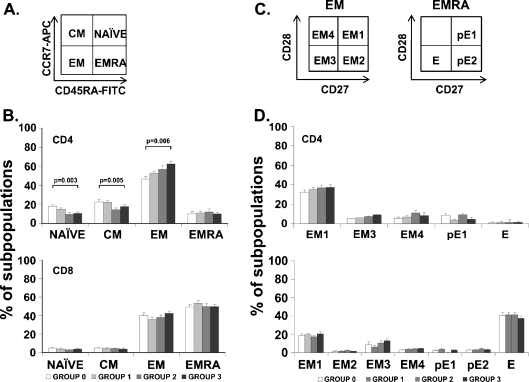
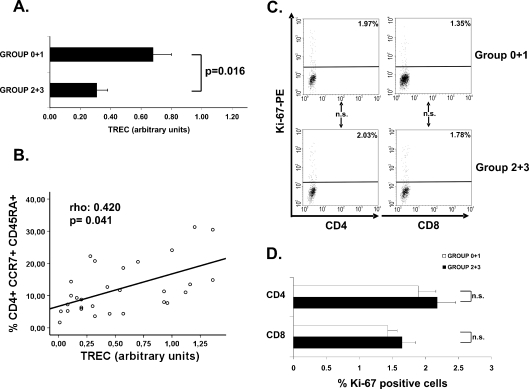
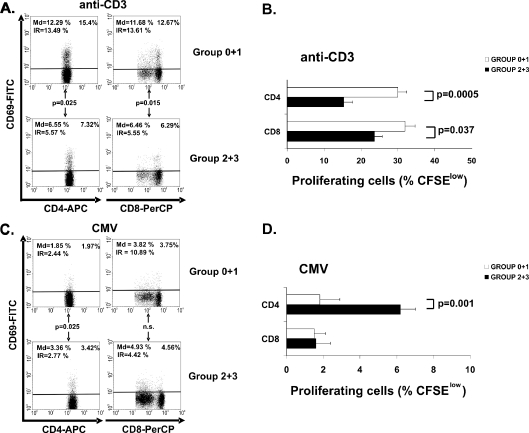
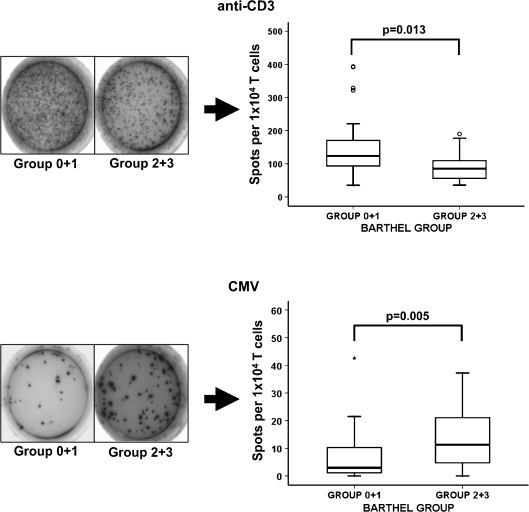
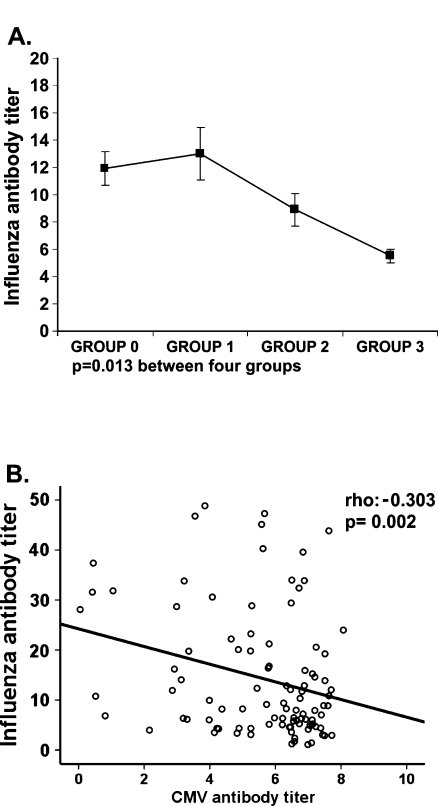
Shorter survival in the elderly has been associated with deterioration of the immune system and also with functional disability. To analyze the relationship between functional and immune impairment in older individuals, we studied 100 elderly who lived in a nursing home, were age matched, and grouped according to their functional status. We characterized cell subpopulations by flow cytometry, quantified TREC by RT-PCR, and measured the T-cell proliferation and activation response (IFN-γ by ELISPOT, CD69) against anti-CD3 and CMV. Specific antibody titers against influenza virus and CMV were determined by ELISA. Individuals with worse functional status had significantly higher levels of NK cells and fewer B cells. These poorly functioning elders also had a significantly lower proportion of CD4+ T cells, increased CD8+ T cells, and a decreased CD4/CD8 ratio. TREC levels in CD4+ T cells were significantly lower in individuals with a high disability. Lower TREC levels correlated with a lower frequency of naïve T-cell subpopulations (CD45RA+CCR7+) and higher percentages of effector cells (CD45RA-CCR7-). The functionally impaired group had lower anti-CD3 responses, but gradually increased responses against CMV. Similarly, the higher CMV titers were found in elderly with worse functional status. On the contrary, the functional response in vivo, and the titer of antibodies generated after vaccination against influenza virus, was higher in individuals with better performance status. In summary, we concluded that the functional decline of elderly individuals was clearly associated with the aging of their immune system, and the intensity of the response to CMV.


Figures

Fig. 1
Fig. 1
Immune phenotype in peripheral blood from elderly according to their BI group. Elders were stratified according to their BI (group 0 BI = 100, group 1 BI = 95–80, group 2 BI = 75–40, and group 3 BI = 35–0). The number of donors in each group was group 0 = 24, group 1 = 26, group 2 = 27, and group 3 = 23. Whole blood from elderly individuals was stained with different antibody combinations and analyzed by flow cytometry (105 cells acquired in each experiment). Outlier values were represented by circles and extreme values by stars, calculated by adding 1.5 and 3 times the IR to the 75th percentile, respectively. The ANOVA test (when data were normally distributed) and Kruskal–Wallis non-parametric methods (when data were not normally distributed) were used to compare frequencies between groups. p values are depicted in the panels. a Percentages of CD16+56+ and CD19+ cells with respect to the total CD45+ cells were compared between the four groups of elderly. Staining was performed with “Multiset CD3-FITC/CD16+56-PE/CD45-PerCP/CD19-APC” and frequencies of CD16+56 and CD19+ cells in gated CD45+ subsets were analyzed. b Percentages of CD4+ and CD8+ cells were analyzed with respect to the total CD45+CD3+ and were compared between the four groups. Staining was performed with anti-CD3-FITC, anti-CD4-APC, and anti-CD8-PerCP to gate CD4+ and CD8+ T cells. c Percentages of CD4+ T cells expressing CD8 and expressing NKG2D in peripheral blood from elderly. Whole blood was stained with anti-CD3-FITC, anti-NKG2D-PE, anti-CD8-PerCP, and anti-CD4-APC. Frequencies of NKG2D+ cells in gated CD3+CD4+ lymphocytes were quantified
Fig. 2
Fig. 2
CD4/CD8 ratio, anti-CMV antibody titer from elderly of the four BI groups, and correlation between the CMV antibody titer and the BI score in women and men. The two most important parameters that define the immune risk profile (IRP) are the inverted CD4/CD8 ratio and CMV infection. a CD4/CD8 ratios were analyzed and compared between the four groups. Staining was performed with anti-CD3-FITC, anti-CD4-APC, and anti-CD8-PerCP to gate CD4+ and CD8+ T cells. CD4/CD8 ratio less than 1.0 was used to identify individuals with an IRP. b Serum anti-CMV antibody titer was measured by ELISA and compared between the BI groups. Patient samples are quantified and interpreted by means of the calculation of the ratio (cut-off index = OD value of sample/cut-off value), whereby a ratio of 1.0 is equivalent to the cut-off value. Cut-off index >1.1 were considered positive and the result of this ratio is a semi-quantitative titer. Outlier and extreme values are represented by circles and extreme values by stars, calculated by adding 1.5 and 3 times the IR to the 75th percentile, respectively. The Kruskal–Wallis non-parametric method was used to compare frequencies between groups and p values are depicted in the panels. c Correlation between CMV antibody titer and the BI score in women. d Relationship between CMV antibody titer and BI score in men. A non-parametric Spearman test was applied to calculate the correlations, p value, and coefficient of correlation which are listed in the lower left hand corner
Fig. 3
Fig. 3
Distribution of CD4+ and CD8+ T cells into naïve, central memory, effector memory and effector memory RA, and distribution of EM and EMRA in CD4+ and CD8+ T cells into subsets defined by CD28 and CD27 expression. Expression of CD45RA, CCR7, CD27, and CD28 was analyzed by flow cytometry in isolated CD4+ and CD8+ T cells from the four BI groups of elders. a Schematic model of the T-cell differentiation subsets accordingly to CD45RA and CCR7 expression. Whole blood was stained with anti-CD45RA-FICT, anti-CD8-PE, anti-CD4-PerCP, and anti-CCR7-APC, and 105 cells were acquired in each experiment. b Histograms represent percentage of cells in each subset (NAÏVE, CM, EM, and EMRA) in the four groups of elderly accordingly to their functional status (group 0—white bars, group 1—light gray bars, group 2—dark gray bars, group 3—black bars). Significant differences between subsets are indicated (ANOVA or Kruskal–Wallis non-parametric method). Each bar in the histograms represented the mean ± SEM. c Representative dot plots of the subsets defined by CD27 and CD28 expression for individuals in each group. EM T cells can be divided into EM1 (CD27+CD28+), EM2 (CD27+CD28null, only in CD8+ T cells), EM3 (CD27nullCD28null), and EM4 (CD27nullCD28+). Similarly, EMRA can be divided into pE1 (CD27+CD28+) and pE2 (CD27+CD28null, only in CD8 T cells) and E (CD27nullCD28null). d Percentage of cells in each subset in the four groups of elderly accordingly to their functional status (group 0—white bars, group 1—light gray bars, group 2—dark gray bars, group 3—black bars). Bars in the histograms represented the mean ± SEM
Fig. 4
Fig. 4
TREC content in CD4+ T cells, its correlation with the NAÏVE subset and Ki-67 quantification. a The TREC content was measured in CD4+ T cells from elders belonging to group 0 + 1 (n = 14) and group 2 + 3 (n = 15). CD4+ population was isolated by magnetic bead separation and the TREC copy number was determined by real-time PCR. Experiments were conducted in duplicate and bars represented results from the grouped elders (mean ± SEM). b Relationship between TREC content and NAÏVE (CD4+CCR7+CD45RA+) subset in the four groups of elderly was analyzed. The correlations, p value, and coefficient of correlation were calculated by using the non-parametric Spearman test and are listed in the upper left hand corner. c The quantification of Ki-67 was performed in CD4+ and CD8+ T cells from elders belonging to group 0 + 1 (n = 10) and group 2 + 3 (n = 10). CD4+ and CD8+ populations were isolated by magnetic bead separation and the Ki-67 quantification was determined by intracellular staining and flow cytometry. Representative dot plots show the frequency of Ki-67 expression in CD4+ and CD8+ subsets from elderly with different functional status. Percentage of positive cells in each subpopulation in these representative experiments are expressed in the upper right corner. Appropriate isotype control mAbs were used for marker settings. d Histograms summarize the percentage of positive cells for Ki-67 (mean ± SEM). The Student’s t test method was used to compare frequencies between groups
Fig. 5
Fig. 5
CD69 expression and proliferative capacity of CD4+ and CD8+ depending on the functional capacity. Whole blood from the BI groups of elders (group 0 + 1, n = 12 and group 2 + 3, n = 14) was stimulated for 18 h and expression of CD69 in CD4+ and CD8+ T cells was evaluated by flow cytometry. Proliferative capacity of CD4+ and CD8+ T cells subsets was also evaluated in the two groups (group 0 + 1, n = 19 and group 2 + 3, n = 16) by labeling the PBMC with CFSE. Cells were stained and 1 × 105 cells were acquired per experiment. a Representative dot plots showing the frequency of CD69 expression in CD4+ and CD8+ subset from elderly with different functional status. Cells were stimulated using anti-CD3 (10 ng/mL). Percentage of positive cells in each subpopulation in this representative experiment is expressed in the upper right corner and summarized results from all donors (median and IR) were also expressed in dot plots. b Proliferative capacity of CD4+ and CD8+ T cells subsets in response to anti-CD3. PBMC were labeled with CFSE (1.5 μM) and cultured in presence of anti-CD3 (10 ng/mL) for 5 days. Percentage of dividing CD4+ and CD8+ T cells is represented. Bars represent results from the grouped elders (mean ± SEM). c Expression of CD69 into de CD4+ and CD8+ T cell subset was analyzed in the same way as in Fig. 5a in response to a CMV supernatant (104 PFU/mL). d Proliferative capacity of CD4+ and CD8+ T-cell subsets in response to the CMV supernatant. Bars represent resulted from the grouped elders (mean ± SEM). The Student’s t test (when data were normally distributed) and Mann–Whitney non-parametric (when data were not normally distributed) methods were used to compare frequencies between groups. p values are depicted in the panels
Fig. 6
Fig. 6
IFN-γ production in response to anti-CD3 and to CMV antigens. Production of IFN-γ was measured in the two groups of elders (group 0 + 1, n = 28 and group 2 + 3, n = 21) by ELISPOT assay. PBMCs from elderly were stimulated with anti-CD3 (10 ng/mL) or CMV extracts (104 PFU/mL) for 20 h at 37°C/5% CO2. An example of the spots generated in response to anti-CD3 and to CMV is represented for both groups. The mean numbers of antigen-specific spot forming cells after background subtraction of control wells with no antigen were plotted. Experiments were conducted in triplicate. Outlier values are represented by circles and extreme values by stars, calculated by adding 1.5 and 3 times the IR to the 75th percentile, respectively. The Student’s t test (when data were normally distributed) and Mann–Whitney non-parametric (when data were not normally distributed) methods were used to compare frequencies between groups and p values are depicted in the panels
Fig. 7
Fig. 7
Response to influenza virus vaccination and its correlation to CMV titer. Influenza antibodies titer was quantified by ELISA in the serum of the elders after vaccination. a The Kruskal–Wallis non-parametric method was used to compare the influenza antibody titer between the four groups. b Relationship between influenza and CMV antibody titer in the four groups of elderly was analyzed. A non-parametric Spearman test was applied to calculate the correlations, p value and coefficient of correlation are listed in the upper right hand corner

References

    1. Alonso-Arias R, Lopez-Vazquez A, Diaz-Pena R, Sampere A, Tricas L, Asensi V, Rodrigo L, Lopez-Larrea C. CD8dim and NKG2D expression defines related subsets of CD4+ T cells in HIV-infected patients with worse prognostic factors. J Acquir Immune Defic Syndr. 2009;51:390–398. doi: 10.1097/FTD.0b013e3181679015. - DOI - PubMed
    1. Alonso-Arias R, Moro-Garcia MA, Lopez-Vazquez A, Rodrigo L, Baltar J, Garcia FM, Jaurrieta JJ, Lopez-Larrea C (2011) NKG2D expression in CD4+ T lymphocytes as a marker of senescence in the aged immune system. Age (Dordr) [Epub ahead of print] - PMC - PubMed
    1. Amyes E, Hatton C, Montamat-Sicotte D, Gudgeon N, Rickinson AB, McMichael AJ, Callan MF. Characterization of the CD4+ T cell response to Epstein–Barr virus during primary and persistent infection. J Exp Med. 2003;198:903–911. doi: 10.1084/jem.20022058. - DOI - PMC - PubMed
    1. Appay V, Dunbar PR, Callan M, Klenerman P, Gillespie GM, Papagno L, Ogg GS, King A, Lechner F, Spina CA, Little S, Havlir DV, Richman DD, Gruener N, Pape G, Waters A, Easterbrook P, Salio M, Cerundolo V, McMichael AJ, Rowland-Jones SL. Memory CD8+ T cells vary in differentiation phenotype in different persistent virus infections. Nat Med. 2002;8:379–385. doi: 10.1038/nm0402-379. - DOI - PubMed
    1. Aspinall R, Andrew D. Thymic involution in aging. J Clin Immunol. 2000;20:250–256. doi: 10.1023/A:1006611518223. - DOI - PubMed

Publication types