

Coronary-aortic interaction during ventricular isovolumic contraction
- PMID: 21487819
- PMCID: PMC3139876
- DOI: 10.1007/s11517-011-0770-y
Coronary-aortic interaction during ventricular isovolumic contraction
Abstract
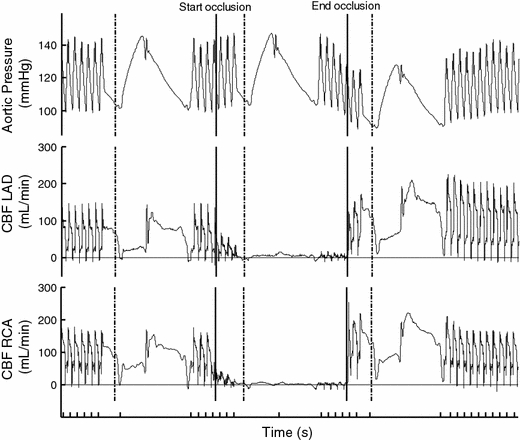
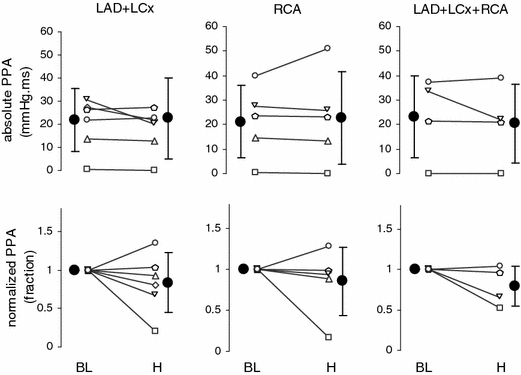
In earlier work, we suggested that the start of the isovolumic contraction period could be detected in arterial pressure waveforms as the start of a temporary pre-systolic pressure perturbation (AIC(start), start of the Arterially detected Isovolumic Contraction), and proposed the retrograde coronary blood volume flow in combination with a backwards traveling pressure wave as its most likely origin. In this study, we tested this hypothesis by means of a coronary artery occlusion protocol. In six Yorkshire × Landrace swine, we simultaneously occluded the left anterior descending (LAD) and left circumflex (LCx) artery for 5 s followed by a 20-s reperfusion period and repeated this sequence at least two more times. A similar procedure was used to occlude only the right coronary artery (RCA) and finally all three main coronary arteries simultaneously. None of the occlusion protocols caused a decrease in the arterial pressure perturbation in the aorta during occlusion (P > 0.20) nor an increase during reactive hyperemia (P > 0.22), despite a higher deceleration of coronary blood volume flow (P = 0.03) or increased coronary conductance (P = 0.04) during hyperemia. These results show that the pre-systolic aortic pressure perturbation does not originate from the coronary arteries.
Figures


References
-
- Baum D, Halter JB, Taborsky GJ, Jr, Porte D., Jr Pentobarbital effects on plasma catecholamines: temperature, heart rate, and blood pressure. Am J Physiol. 1985;248:E95–E100. - PubMed
-
- Cockcroft JR, Wilkinson IB. Arterial stiffness and pulse contour analysis: An age old concept revisited. Clin Sci (Lond) 2002;103:379–380. - PubMed
-
- Davies JE, Whinnett ZI, Francis DP, Manisty CH, Aguado-Sierra J, Willson K, Foale RA, Malik IS, Hughes AD, Parker KH, Mayet J. Evidence of a dominant backward-propagating “Suction” wave responsible for diastolic coronary filling in humans, attenuated in left ventricular hypertrophy. Circulation. 2006;113:1768–1778. doi: 10.1161/CIRCULATIONAHA.105.603050. - DOI - PubMed
Publication types
MeSH terms
LinkOut - more resources
Full Text Sources
