

Comparative supragenomic analyses among the pathogens Staphylococcus aureus, Streptococcus pneumoniae, and Haemophilus influenzae using a modification of the finite supragenome model
- PMID: 21489287
- PMCID: PMC3094309
- DOI: 10.1186/1471-2164-12-187
Comparative supragenomic analyses among the pathogens Staphylococcus aureus, Streptococcus pneumoniae, and Haemophilus influenzae using a modification of the finite supragenome model
Abstract
Background: Staphylococcus aureus is associated with a spectrum of symbiotic relationships with its human host from carriage to sepsis and is frequently associated with nosocomial and community-acquired infections, thus the differential gene content among strains is of interest.
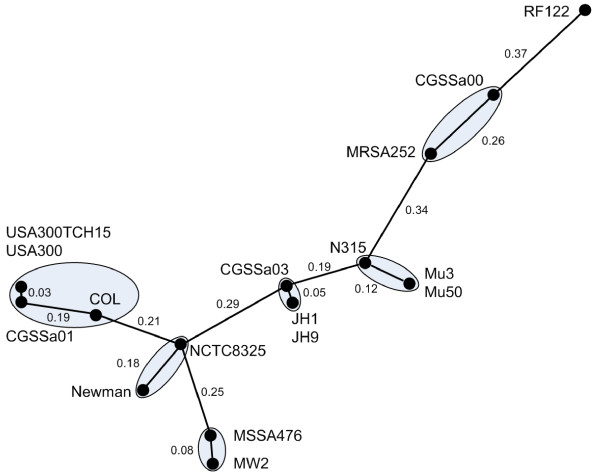
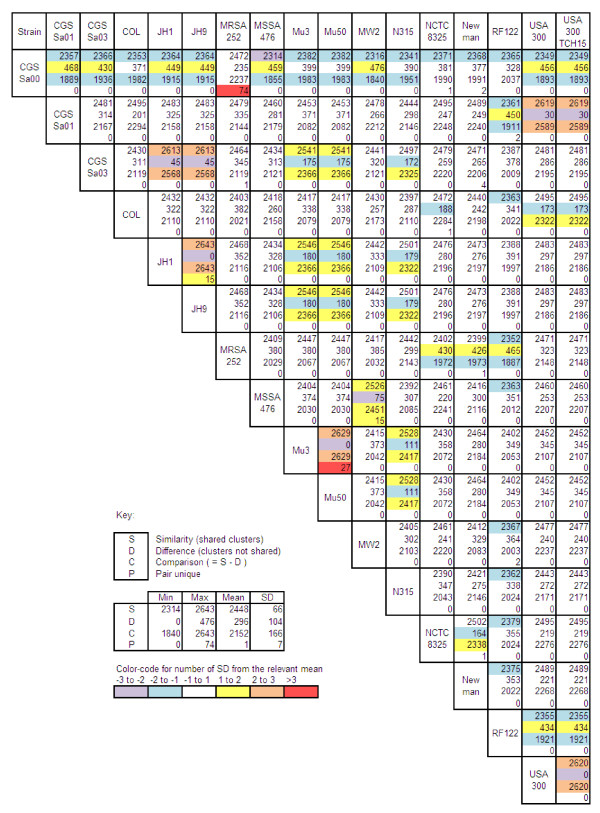
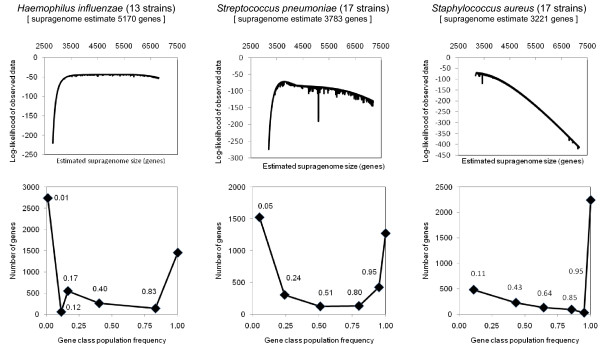
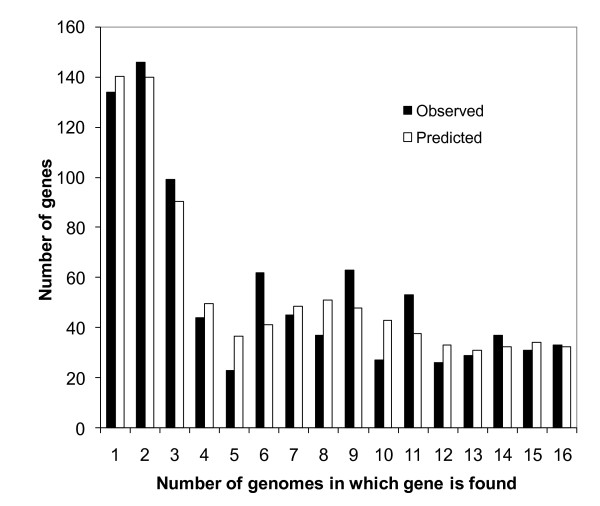
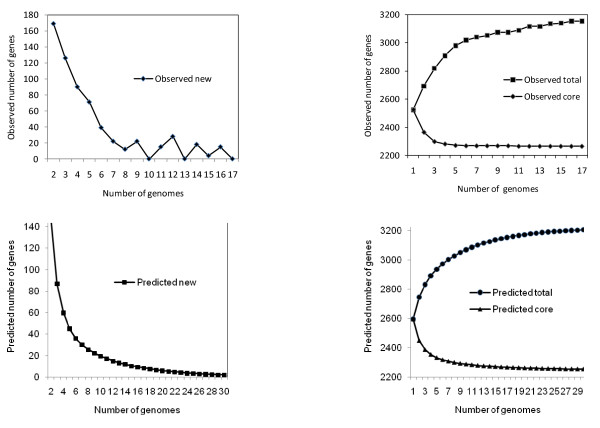
Results: We sequenced three clinical strains and combined these data with 13 publically available human isolates and one bovine strain for comparative genomic analyses. All genomes were annotated using RAST, and then their gene similarities and differences were delineated. Gene clustering yielded 3,155 orthologous gene clusters, of which 2,266 were core, 755 were distributed, and 134 were unique. Individual genomes contained between 2,524 and 2,648 genes. Gene-content comparisons among all possible S. aureus strain pairs (n = 136) revealed a mean difference of 296 genes and a maximum difference of 476 genes. We developed a revised version of our finite supragenome model to estimate the size of the S. aureus supragenome (3,221 genes, with 2,245 core genes), and compared it with those of Haemophilus influenzae and Streptococcus pneumoniae. There was excellent agreement between RAST's annotations and our CDS clustering procedure providing for high fidelity metabolomic subsystem analyses to extend our comparative genomic characterization of these strains.
Conclusions: Using a multi-species comparative supragenomic analysis enabled by an improved version of our finite supragenome model we provide data and an interpretation explaining the relatively larger core genome of S. aureus compared to other opportunistic nasopharyngeal pathogens. In addition, we provide independent validation for the efficiency and effectiveness of our orthologous gene clustering algorithm.
Figures
Similar articles
-
Comparative genomic analyses of seventeen Streptococcus pneumoniae strains: insights into the pneumococcal supragenome.J Bacteriol. 2007 Nov;189(22):8186-95. doi: 10.1128/JB.00690-07. Epub 2007 Aug 3. J Bacteriol. 2007. PMID: 17675389 Free PMC article.
-
Epidemiological Markers for Interactions Among Streptococcus pneumoniae, Haemophilus influenzae, and Staphylococcus aureus in Upper Respiratory Tract Carriage.J Infect Dis. 2016 May 15;213(10):1596-605. doi: 10.1093/infdis/jiv761. Epub 2015 Dec 23. J Infect Dis. 2016. PMID: 26704617 Free PMC article. Clinical Trial.
-
Carriage of Streptococcus pneumoniae, Haemophilus influenzae, Moraxella catarrhalis, and Staphylococcus aureus in Indonesian children: A cross-sectional study.PLoS One. 2018 Apr 12;13(4):e0195098. doi: 10.1371/journal.pone.0195098. eCollection 2018. PLoS One. 2018. PMID: 29649269 Free PMC article.
-
Characterization and modeling of the Haemophilus influenzae core and supragenomes based on the complete genomic sequences of Rd and 12 clinical nontypeable strains.Genome Biol. 2007;8(6):R103. doi: 10.1186/gb-2007-8-6-r103. Genome Biol. 2007. PMID: 17550610 Free PMC article.
-
Density interactions among Streptococcus pneumoniae, Haemophilus influenzae and Staphylococcus aureus in the nasopharynx of young Peruvian children.Pediatr Infect Dis J. 2013 Jan;32(1):72-7. doi: 10.1097/INF.0b013e318270d850. Pediatr Infect Dis J. 2013. PMID: 22935873 Free PMC article.
Cited by
-
Nontypeable Haemophilus influenzae genetic islands associated with chronic pulmonary infection.PLoS One. 2012;7(9):e44730. doi: 10.1371/journal.pone.0044730. Epub 2012 Sep 6. PLoS One. 2012. PMID: 22970300 Free PMC article.
-
Comparative genomic analyses of 17 clinical isolates of Gardnerella vaginalis provide evidence of multiple genetically isolated clades consistent with subspeciation into genovars.J Bacteriol. 2012 Aug;194(15):3922-37. doi: 10.1128/JB.00056-12. Epub 2012 May 18. J Bacteriol. 2012. PMID: 22609915 Free PMC article.
-
Characterization of the family-level Borreliaceae pan-genome and development of an episomal typing protocol.Res Sq [Preprint]. 2024 Jun 11:rs.3.rs-4491589. doi: 10.21203/rs.3.rs-4491589/v1. Res Sq. 2024. Update in: mBio. 2025 Jun 11;16(6):e0094325. doi: 10.1128/mbio.00943-25. PMID: 38947078 Free PMC article. Updated. Preprint.
-
Antagonistic Pleiotropy in the Bifunctional Surface Protein FadL (OmpP1) during Adaptation of Haemophilus influenzae to Chronic Lung Infection Associated with Chronic Obstructive Pulmonary Disease.mBio. 2018 Sep 25;9(5):e01176-18. doi: 10.1128/mBio.01176-18. mBio. 2018. PMID: 30254117 Free PMC article.
-
Comparison of transcription of the Haemophilus influenzae iron/heme modulon genes in vitro and in vivo in the chinchilla middle ear.BMC Genomics. 2013 Dec 27;14:925. doi: 10.1186/1471-2164-14-925. BMC Genomics. 2013. PMID: 24373462 Free PMC article.
References
Publication types
MeSH terms
Grants and funding
LinkOut - more resources
Full Text Sources
Other Literature Sources
