. 2011 Sep;60(9):1259-70.
doi: 10.1016/j.metabol.2011.01.008. Epub 2011 Apr 12.

Sucrose induces fatty liver and pancreatic inflammation in male breeder rats independent of excess energy intake

Affiliations

Sucrose induces fatty liver and pancreatic inflammation in male breeder rats independent of excess energy intake

Carlos A Roncal-Jimenez et al. Metabolism. 2011 Sep.

Abstract

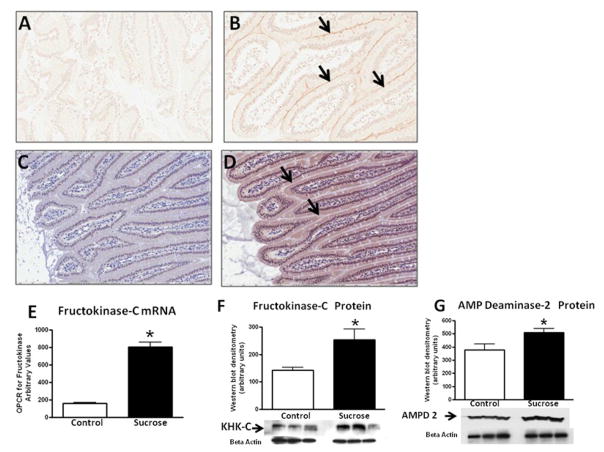
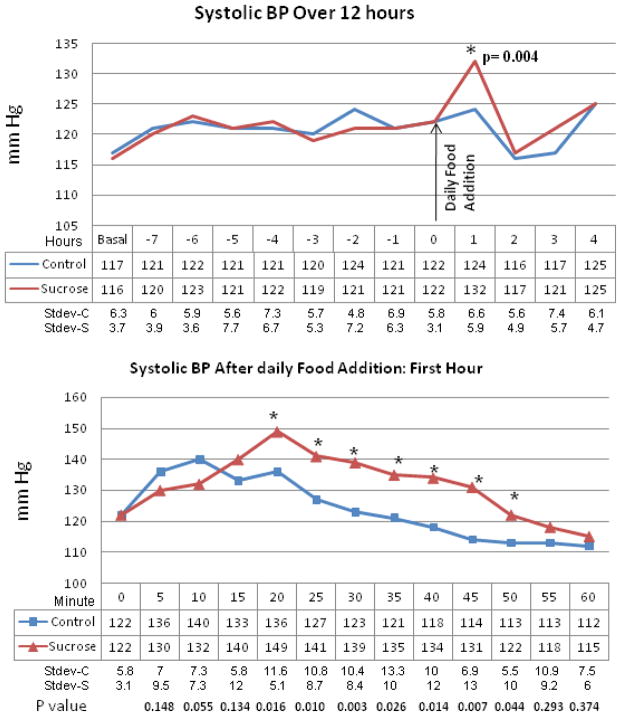
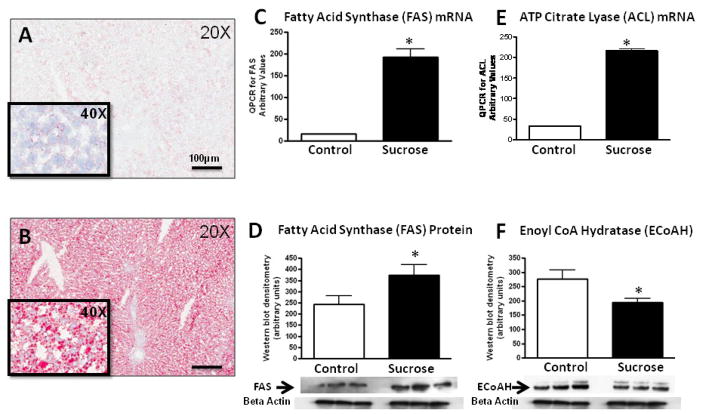
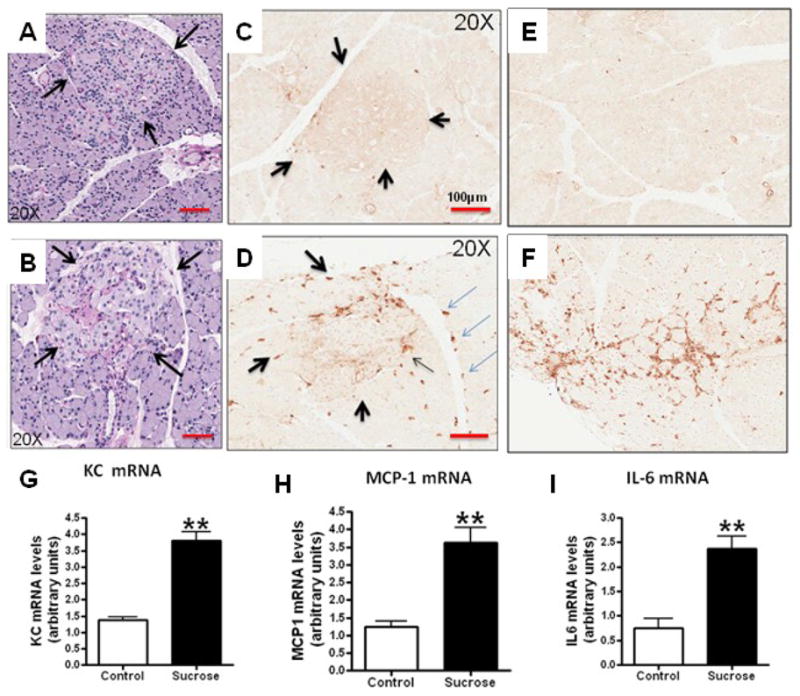
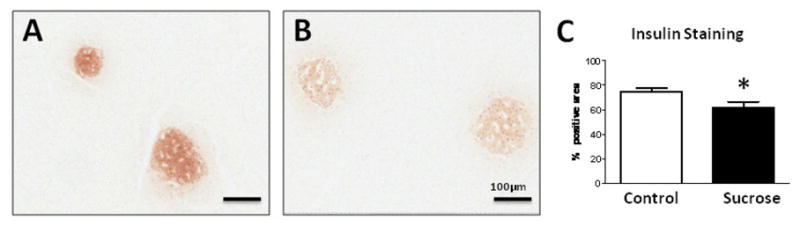
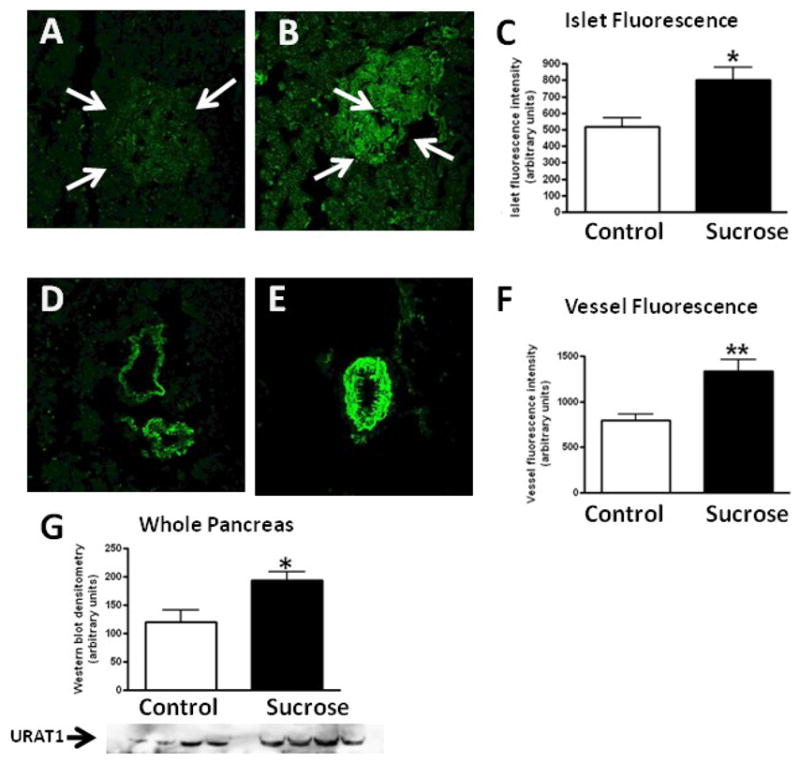
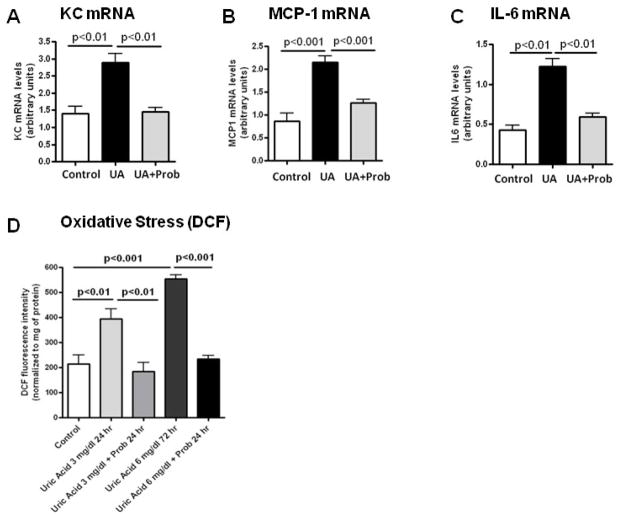
Fructose induces metabolic syndrome in rats; but studies have been criticized for using high concentrations of fructose that are not physiologic, for using only pure fructose, and for not controlling for energy intake. We tested the hypothesis that a 40% sucrose diet (containing 20% fructose) might induce features of metabolic syndrome in male breeder rats independent of excess energy intake. Male Sprague-Dawley breeder rats were pair fed 40% sucrose or isocaloric starch diet for 4 months and evaluated for metabolic syndrome and diabetes. In vitro studies were performed in rat insulinoma cells (RIN-m5F) exposed to uric acid, and markers of inflammation were assessed. Rats fed a 40% sucrose diet developed accelerated features of metabolic syndrome with up-regulation of fructose-dependent transporter Glut5 and fructokinase. Fatty liver and low-grade pancreatic inflammation also occurred. Uric acid was found to stimulate inflammatory mediators and oxidative stress in islet cells in vitro. Sucrose, at concentrations ingested by a subset of Americans, can accelerate metabolic syndrome, fatty liver, and type 2 diabetes mellitus in male breeder rats; and the effects are independent of excess energy intake.


Conflict of interest statement

Disclaimers and Conflict of Interest

Dr R Johnson, Dr Nakagawa, and Dr Lanaspa have patent applications related to lowering uric acid or blocking fructose metabolism in the treatment of metabolic syndrome. Dr Johnson also has a book, the Sugar Fix (Rodale, 2008; and Simon and Schuster, 2009) that discusses the potential role of fructose in the obesity epidemic.

Figures

Figure 1
Figure 1. Expression of Glut 5 and Fructokinase
Jejunal tissues obtained from starch and sucrose-fed rats were examined for the fructose transporter, Glut 5, and for fructokinase-C. In contrast to control rats (A), immunostaining showed the expression of Glut 5 along the apical border (B, light brown line highlighted by arrows). Compared to control rats (C), fructokinase was also increased in the cytoplasm of the sucrose-fed rats (D, brown colored cytoplasm, see arrows). Sucrose fed rats showed an increased hepatic expression of fructokinase mRNA (E), fructokinase protein (F) and AMP Deaminase 2 protein (G) compared to starch-fed rats. A and B, 40 x; C and D, 20x *p<0.05.
Figure 2
Figure 2. Systolic Blood Pressure in Control versus Sucrose Fed Rats
Upper panel: Systolic blood pressures as measured by telemetry over a 12 hour period. Mean blood pressures remain no different between control (starch fed, blue line, n=8) and sucrose-fed (red line, n=9) rats except for the first hour after introduction of food. Lower panel: Serial blood pressures during the first hour after exposure to food shows significant increases in blood pressure in the sucrose fed rats. *p=0.004 Shown are measurements obtained at 2 weeks after initiating the diet.
Figure 3
Figure 3. Effects of Diet on Fatty Liver
Rat liver tissue obtained at 4 months shows negative staining for fat by Oil Red O stain in starch-fed, control rats (A) whereas diffuse micro and macrovesicular fat deposits are present in sucrose-fed rats (B). QPCR analysis of whole liver tissues shows an increase in Fatty acid synthase (C) and ATP Citrate Lysate mRNA (D) in Sucrose-fed rats. Western blots confirmed an increase in Fatty Acid Synthase protein (E) and a decrease in Enoyl CoA hydratase-1 protein in sucrose-fed rats (F). Key, A and B, Oil Red Stain, 20X magnification. *, p<0.05
Figure 4
Figure 4. Islet Injury and Inflammation
PAS-stained pancreas shows that islets from Starch-fed control rats (identified by arrows) appear normal (A, 20x). In contrast, islets from sucrose-fed rats show focal hyalinization (B, 20x). Whereas macrophages (ED-1 staining) were infrequent in islets (C, 20x) and pancreatic interstitium (E, 10x) of starch fed rats, macrophages were present in both the islets (D, arrows) in venous endothelium (D, light blue arrows) and the interstitium (F, 10x) in sucrose-fed rats). These changes were associated with an increase in KC mRNA, MCP-1 mRNA and IL-6 mRNA in whole pancreas RNA extracts from sucrose fed rats compare to starch fed controls (Figures G–I). *p<0.05, **p<0.01
Figure 5
Figure 5. Decreased Insulin Staining and Expression of Inflammatory Mediators in Sucrose-Fed Rats
In contrast to starch-fed rats (A), sucrose-fed rats had decreased insulin staining of islets by both intensity and area (B). Quantification documented decreased insulin staining area (C). Western blotting of whole pancreatic extracts for insulin….*p<0.05, **p<0.01 10x
Figure 6
Figure 6. URAT1 Expression in Pancreatic Islets
Minimal URAT-1 was expressed by islets in starch fed rats by immunofluorsescence (highlighted by arrows, A) in contrast to sucrose-fed rats (B). Blood vessels also showed minimal URAT-1 staining in starch-fed (D) in contrast to sucrose-fed rats (E). Quantitative immunofluorescence for URAT-1 staining in the islets and blood vessels are shown in C and F. Total URAT-1 protein in whole pancreas by Western blotting showed an approximately 30% increase in URAT-1 in sucrose-fed rats (G). The relatively small increase in URAT-1 protein by Western despite the marked difference in immunostaining is likely because the former is of whole pancreatic extracts that includes the acinar tissue. *p<0.05. 20x.
Figure 7
Figure 7. Effect of Uric acid on Rat Pancreatic Islet Cells
Pancreatic RIN-m5F cells were exposed for 48 hours to varying concentrations of uric acid in the presence or absence of the URAT-1 inhibitor probenecid (1 mM). Uric acid (UA, 6 mg/dl) significantly increased the mRNA expression of the inflammatory markers KC (Fig A), MCP-1 (Fig B) and IL-6 (Fig C). Uric acid ( 3 and 6 mg/dl) also stimulated oxidative stress, as assessed by oxidized DCF fluorescence (Fig D). that the effects of uric acid to induce cytokine expression and oxidative stress was blocked by probenecid (2 mM) (Figs A–D)

References

    1. Havel PJ. Dietary fructose: implications for dysregulation of energy homeostasis and lipid/carbohydrate metabolism. Nutrition reviews. 2005;63:133–157. - PubMed
    1. Kadowaki T, Yamauchi T. Adiponectin and adiponectin receptors. Endocr Rev. 2005;26:439–451. - PubMed
    1. White JS. No unique role for fructose sweeteners in obesity or cardiorenal disease. The American journal of clinical nutrition. 2008;87:1062–1063. author reply 1063–1066. - PubMed
    1. Jones JM. Dietary sweeteners containing fructose: overview of a workshop on the state of the science. The Journal of nutrition. 2009;139:1210S–1213S. - PubMed
    1. Johnson RK, Appel LJ, Brands M, et al. Dietary sugars intake and cardiovascular health: a scientific statement from the American Heart Association. Circulation. 2009;120:1011–1020. - PubMed

Publication types