

Distinct mechanisms for aerenchyma formation in leaf sheaths of rice genotypes displaying a quiescence or escape strategy for flooding tolerance
- PMID: 21489969
- PMCID: PMC3101152
- DOI: 10.1093/aob/mcr086
Distinct mechanisms for aerenchyma formation in leaf sheaths of rice genotypes displaying a quiescence or escape strategy for flooding tolerance
Abstract
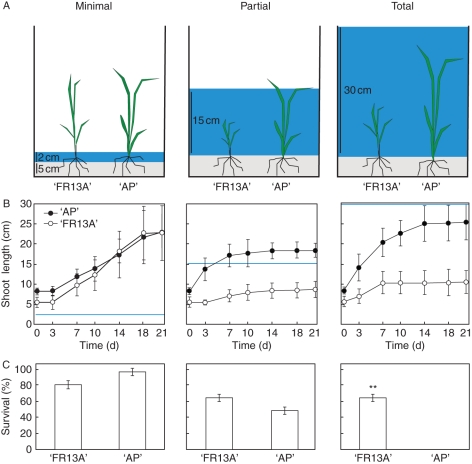
Background and aims: Rice is one of the few crops able to withstand periods of partial or even complete submergence. One of the adaptive traits of rice is the constitutive presence and further development of aerenchyma which enables oxygen to be transported to submerged organs. The development of lysigenous aerenchyma is promoted by ethylene accumulating within the submerged plant tissues, although other signalling mechanisms may also co-exist. In this study, aerenchyma development was analysed in two rice (Oryza sativa) varieties, 'FR13A' and 'Arborio Precoce', which show opposite traits in flooding response in terms of internode elongation and survival.
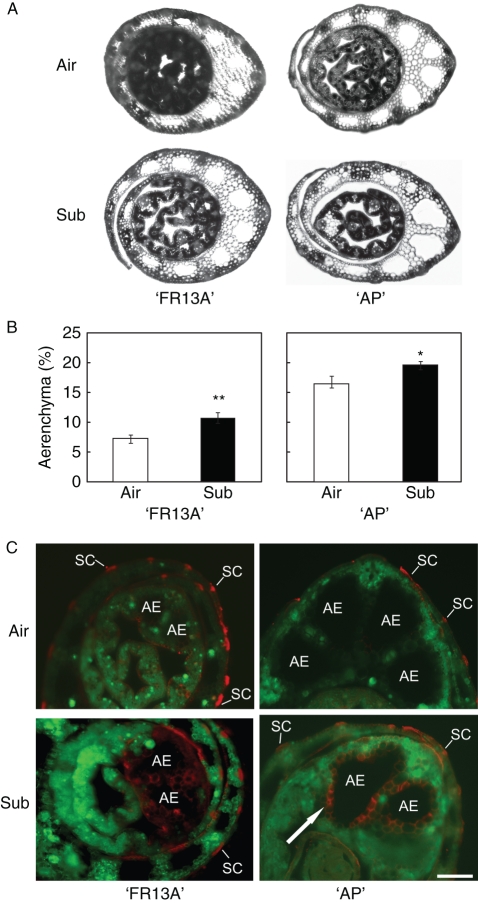
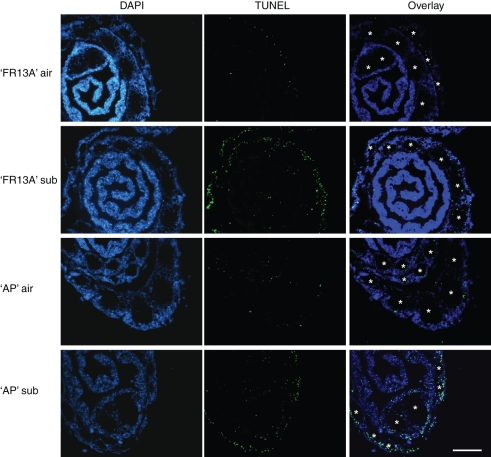
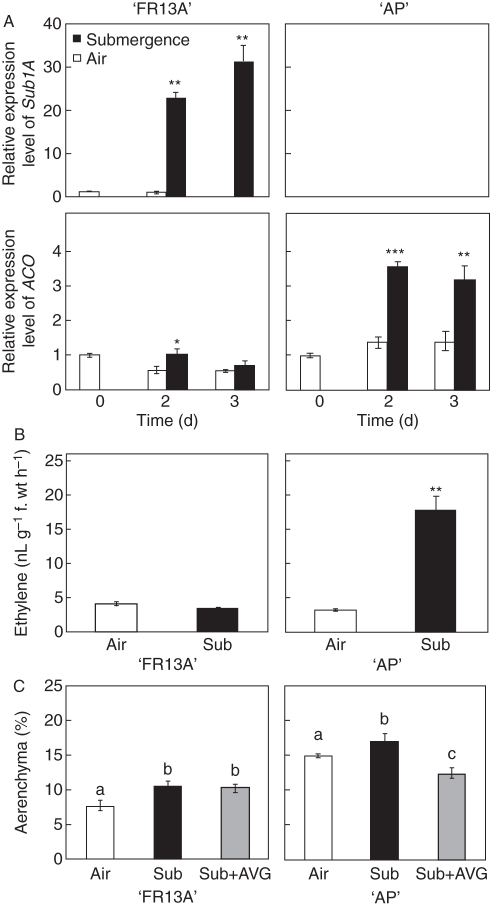
Methods: The growth and survival of rice varieties under submergence was investigated in the leaf sheath of 'FR13A' and 'Arborio Precoce'. The possible involvement of ethylene and reactive oxygen species (ROS) was evaluated in relation to aerenchyma formation. Cell viability and DNA fragmentation were determined by FDA/FM4-64 staining and TUNEL assay, respectively. Ethylene production was monitored by gas chromatography and by analysing ACO gene expression. ROS production was measured by using Amplex Red assay kit and the fluorescent dye DCFH(2)-DA. The expression of APX1 was also evaluated. AVG and DPI solutions were used to test the effect of inhibiting ethylene biosynthesis and ROS production, respectively.
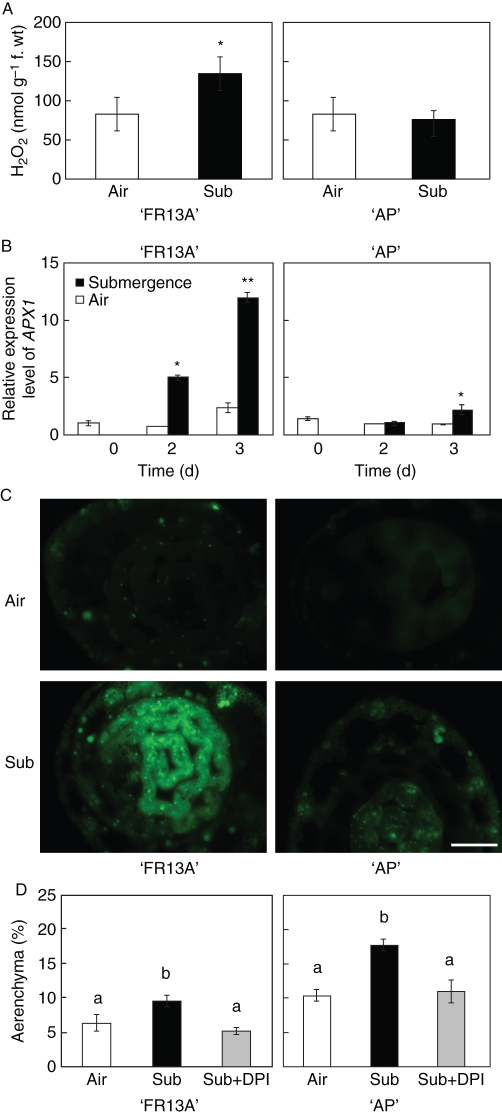
Key results: Both the varieties displayed constitutive lysigenous aerenchyma formation, which was further enhanced when submerged. 'Arborio Precoce', which is characterized by fast elongation when submerged, showed active ethylene biosynthetic machinery associated with increased aerenchymatous areas. 'FR13A', which harbours the Sub1A gene that limits growth during oxygen deprivation, did not show any increase in ethylene production after submersion but still displayed increased aerenchyma. Hydrogen peroxide levels increased in 'FR13A' but not in 'Arborio Precoce'.
Conclusions: While ethylene controls aerenchyma formation in the fast-elongating 'Arborio Precoce' variety, in 'FR13A' ROS accumulation plays an important role.
Figures
Similar articles
-
Physiological and molecular responses of seedlings of an upland rice ('Tung Lu 3') to total submergence compared to those of a submergence-tolerant lowland rice ('FR13A').Rice (N Y). 2017 Aug 31;10(1):42. doi: 10.1186/s12284-017-0180-3. Rice (N Y). 2017. PMID: 28861748 Free PMC article.
-
Ethylene is not involved in adaptive responses to flooding in the Amazonian wild rice species Oryza grandiglumis.J Plant Physiol. 2015 Feb 1;174:49-54. doi: 10.1016/j.jplph.2014.09.012. Epub 2014 Oct 6. J Plant Physiol. 2015. PMID: 25462966
-
Ethylene-dependent aerenchyma formation in adventitious roots is regulated differently in rice and maize.Plant Cell Environ. 2016 Oct;39(10):2145-57. doi: 10.1111/pce.12766. Epub 2016 Aug 12. Plant Cell Environ. 2016. PMID: 27169562
-
Regulation of submergence-induced enhanced shoot elongation in Oryza sativa L.Ann Bot. 2003 Jan;91 Spec No(2):263-70. doi: 10.1093/aob/mcf121. Ann Bot. 2003. PMID: 12509346 Free PMC article. Review.
-
Unraveling the genetic enigma of rice submergence tolerance: Shedding light on the role of ethylene response factor-encoding gene SUB1A-1.Plant Physiol Biochem. 2024 Jan;206:108224. doi: 10.1016/j.plaphy.2023.108224. Epub 2023 Nov 25. Plant Physiol Biochem. 2024. PMID: 38091930 Review.
Cited by
-
Genetic Variability in Phosphorus Responses of Rice Root Phenotypes.Rice (N Y). 2016 Dec;9(1):29. doi: 10.1186/s12284-016-0102-9. Epub 2016 Jun 13. Rice (N Y). 2016. PMID: 27294384 Free PMC article.
-
An NADPH Oxidase RBOH Functions in Rice Roots during Lysigenous Aerenchyma Formation under Oxygen-Deficient Conditions.Plant Cell. 2017 Apr;29(4):775-790. doi: 10.1105/tpc.16.00976. Epub 2017 Mar 28. Plant Cell. 2017. PMID: 28351990 Free PMC article.
-
The role of ethylene and ROS in salinity, heavy metal, and flooding responses in rice.Front Plant Sci. 2014 Dec 4;5:685. doi: 10.3389/fpls.2014.00685. eCollection 2014. Front Plant Sci. 2014. PMID: 25538719 Free PMC article.
-
Future flooding tolerant rice germplasm: Resilience afforded beyond Sub1A gene.Plant Genome. 2025 Jun;18(2):e70040. doi: 10.1002/tpg2.70040. Plant Genome. 2025. PMID: 40341830 Free PMC article.
-
Flooding tolerance in Rice: adaptive mechanism and marker-assisted selection breeding approaches.Mol Biol Rep. 2023 Mar;50(3):2795-2812. doi: 10.1007/s11033-022-07853-9. Epub 2023 Jan 2. Mol Biol Rep. 2023. PMID: 36592290 Review.
References
-
- Armstrong W. Radial oxygen losses from intact rice roots as affected by distance from the apex, respiration, and waterlogging. Physiologia Plantarum. 1971;25:192–197.
-
- Atwell BJ, Drew MC, Jackson MB. The influence of oxygen deficiency on ethylene synthesis, l-aminocyclopropane-l-carboxylic acid levels and aerenchyma formation in roots of Zea mays L. Physiologia Plantarum. 1988;72:15–22.
-
- Bailey-Serres J, Voesenek LACJ. Flooding stress: acclimations and genetic diversity. Annual Review of Plant Biology. 2008;59:313–339. - PubMed
-
- Bailey-Serres J, Voesenek LACJ. Life in the balance: a signaling network controlling survival of flooding. Current Opinion in Plant Biology. 2010;13:489–494. - PubMed
-
- Bailey-Serres J, Fukao T, Ronald P, Ismail A, Heuer S, Mackill D. Submergence tolerant rice: SUB1's journey from landrace to modern cultivar. Rice. 2010;3:138–147.
