. 2011 Jun 3;286(22):19381-91.
doi: 10.1074/jbc.M111.218040. Epub 2011 Apr 13.

Serine/threonine kinase 17A is a novel p53 target gene and modulator of cisplatin toxicity and reactive oxygen species in testicular cancer cells

Affiliations

Serine/threonine kinase 17A is a novel p53 target gene and modulator of cisplatin toxicity and reactive oxygen species in testicular cancer cells

Pingping Mao et al. J Biol Chem. .

Abstract

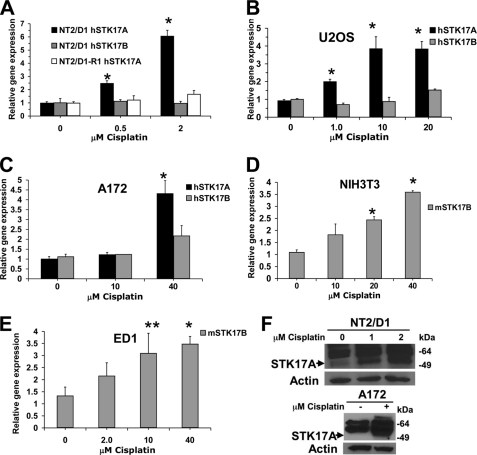
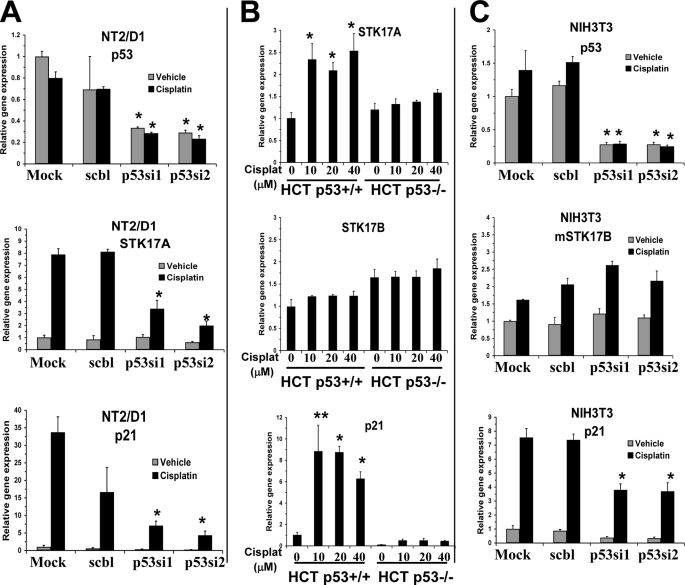
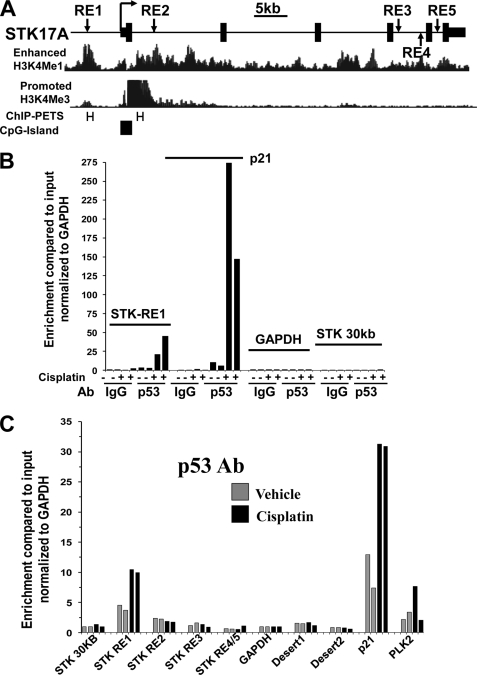
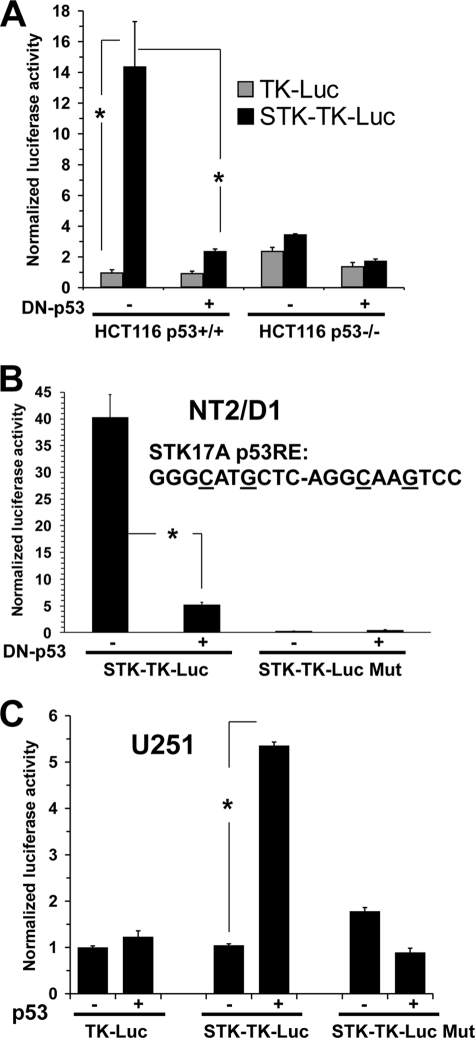
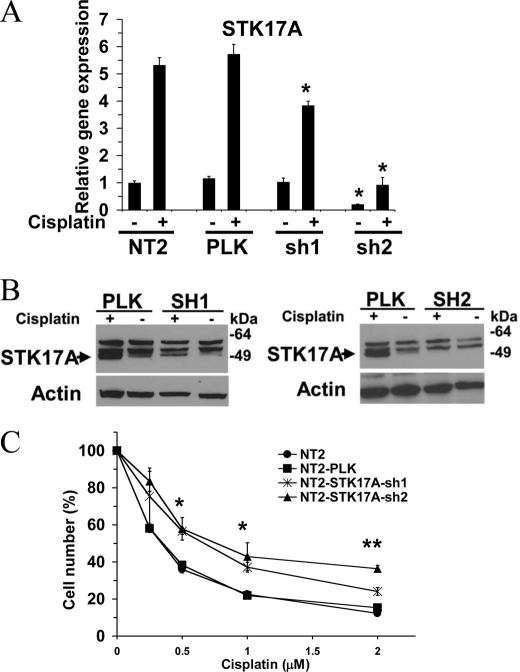
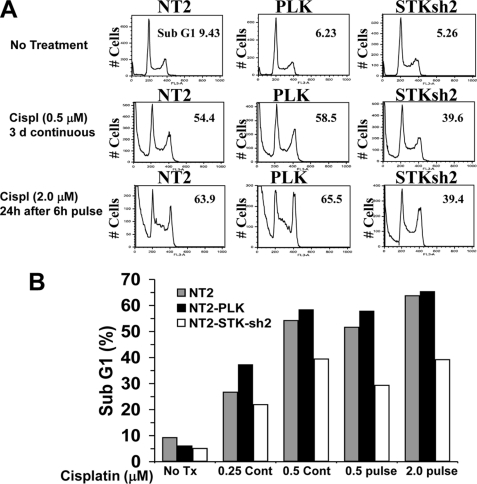
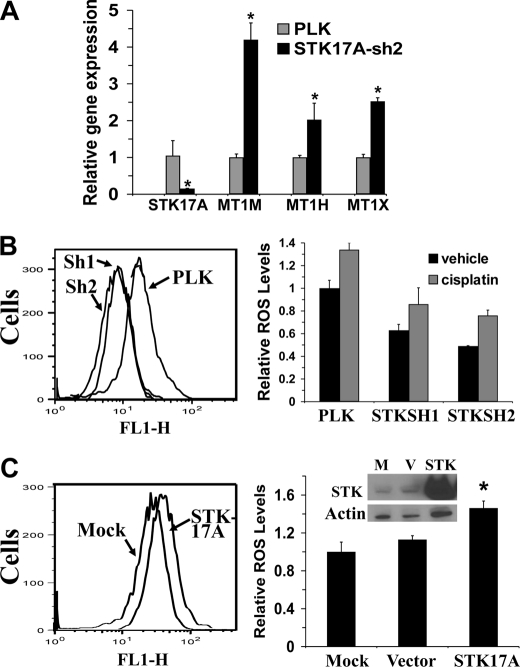
Testicular cancer is highly curable with cisplatin-based therapy, and testicular cancer-derived human embryonal carcinoma (EC) cells undergo a p53-dominant transcriptional response to cisplatin. In this study, we have discovered that a poorly characterized member of the death-associated protein family of serine/threonine kinases, STK17A (also called DRAK1), is a novel p53 target gene. Cisplatin-mediated induction of STK17A in the EC cell line NT2/D1 was prevented with p53 siRNA. Furthermore, STK17A was induced with cisplatin in HCT116 and MCF10A cells but to a much lesser extent in isogenic p53-suppressed cells. A functional p53 response element that binds endogenous p53 in a cisplatin-dependent manner was identified 5 kb upstream of the first coding exon of STK17A. STK17A is not present in the mouse genome, but the closely related gene STK17B is induced with cisplatin in mouse NIH3T3 cells, although this induction is p53-independent. Interestingly, in human cells containing both STK17A and STK17B, only STK17A is induced with cisplatin. Knockdown of STK17A conferred resistance to cisplatin-induced growth suppression and apoptotic cell death in EC cells. This was associated with the up-regulation of detoxifying and antioxidant genes, including metallothioneins MT1H, MT1M, and MT1X that have previously been implicated in cisplatin resistance. In addition, knockdown of STK17A resulted in decreased cellular reactive oxygen species, whereas STK17A overexpression increased reactive oxygen species. In summary, we have identified STK17A as a novel direct target of p53 and a modulator of cisplatin toxicity and reactive oxygen species in testicular cancer cells.


Figures

FIGURE 1.
FIGURE 1.
STK17A is induced with cisplatin in a variety of cell lines. A, STK17A is induced with cisplatin in cisplatin-sensitive human NT2/D1 cells but not in cisplatin-resistant NT2/D1-R1 cells. Real time PCR analysis was performed on RNA harvested 24 h following a 6-h cisplatin treatment. B and C, STK17A but not STK17B is induced with cisplatin in human U2OS osteosarcoma and A172 human glioblastoma cells treated with cisplatin as in A. Expression was measured by real time PCR. D and E, STK17B is induced with cisplatin in mouse NIH3T3 and mouse lung cancer ED1 cells. Real time PCR analysis was performed on RNA harvested 24 h following a 6-h cisplatin treatment. F, STK17A protein is induced with cisplatin in NT2/D1 and A172 cells as determined by Western analysis. The band representing STK17A is directly below the two nonspecific bands. All data points represent the average of biologic triplicates. Error bars are S.D. *, p < 0.01; **, p < 0.05. Data are representative of at least two independent experiments.
FIGURE 2.
FIGURE 2.
STK17A is induced with cisplatin in a p53-dependent manner. A, cisplatin induction of STK17A in NT2/D1 cells is repressed with p53 siRNA knockdown. Expression analysis of p53 (top panel), STK17A (middle panel), or p21 (bottom panel) in NT2/D1 cells mock-transfected or transfected with either control siRNA (scbl) or two independent siRNAs targeting p53 and then treated with cisplatin for 6 h followed by real time PCR analysis 24 h later. *, p < 0.01 compared with identically treated control cells. B, STK17A is up-regulated following cisplatin (Cisplat) treatment of wild-type HCT116 cells (HCT116p53+/+) but to a much lesser extent in the isogenic p53-deleted line (HCT116p53−/−), whereas STK17B is not induced with cisplatin and not repressed in HCT116p53−/− cells. Cells were treated with cisplatin and harvested as in A for real time PCR analysis of STK17A (top), STK17B (middle), and p21 (bottom). *, p < 0.02; **, p < 0.05 compared with no cisplatin treatment. C, STK17B is up-regulated with cisplatin in a p53-independent manner in NIH3T3 cells. Expression of p53 (top panel), STK17B (middle panel), or p21 (bottom panel) in NIH3T3 cells mock-transfected or transfected with either control siRNA (scbl) or two independent siRNA targeting mouse p53 and then treated with cisplatin for 6 h followed by real time PCR analysis 24 h later. *, p < 0.02 compared with the identically treated mock control. All data points represent the average of biological triplicates. Error bars are S.D. Data are representative of at least two independent experiments.
FIGURE 3.
FIGURE 3.
p53 binds in vivo to endogenous p53RE in STK17A. A, genomic organization of the human STK17A gene. Depicted are the locations of predicted p53-responsive elements (RE1–RE5) in relation to the transcriptional start site (arrow), exons (solid boxes), and introns (solid line) of STK17A. Positional enrichment of H3K4Me1 and H3K4Me3 modifications, p53 ChIP-PETs (PET regions are labeled with H), and CpG islands were downloaded from the UCSC Genome Browser assembly March 2006 (NCBI36/hg18). B, ChIP analysis in biological duplicate of NT2/D1 cells treated with 2.0 μm cisplatin for 6 h and harvested 10 h later. A p53 antibody, but not IgG, enriched in a cisplatin-dependent manner DNA fragments containing STK17A-p53RE1 and the well characterized p53 binding site of p21 but not for fragments of the GAPDH promoter or a region of the STK17A gene 30 kb upstream of the transcriptional start site. Real time PCR amplifications were performed for each precipitation with primers surrounding each site normalized to the signal from input DNA. C, an independent ChIP experiment under identical conditions as B with primer sets to STK17A-p53RE1 to STK17A-p53RE5 demonstrates that p53 only binds efficiently to STK17A-p53RE1 and that this was comparable with p53 binding to the previously characterized p53RE in the PLK2 gene. Note that the same primer set was used to detect STK17A-p53RE4 and STK17A-p53RE5 due to their close proximity. Two additional ChIP experiments were performed in biological duplicate and demonstrated greater than 20-fold-enrichment of p53 binding to STK17A-p53RE1.
FIGURE 4.
FIGURE 4.
STK17A contains a functional p53-responsive element. A, reporter assay of HCT116p53+/+ and HCT116p53−/− cells transfected with either TK-Luc control reporter or STK17A reporter (STK-TK-Luc; TK-Luc containing a 350-bp fragment surrounding STK17A-p53RE1) and either a control vector or DN-p53. B, reporter activity of NT2/D1 cells transfected with STK-TK-Luc or STK-TK-Luc-Mut (STK-TK-Luc where the core C and G in each half-site is mutated) and either control vector or DN-p53. C, the U251 cell line containing mutated p53 was transfected with TK-Luc control reporter or STK-TK-Luc or STK-TK-Luc-Mut reporter and either a control vector or a p53 expression vector. All data points are the average of biologic triplicate transfections. Error bars are S.D. *, p < 0.02. Data are representative of at least two independent experiments.
FIGURE 5.
FIGURE 5.
STK17A knockdown results in decreased sensitivity to cisplatin in NT2/D1 cells. A, real time PCR analysis of STK17A expression in control NT2/D1 cells and cells transduced with two independent STK17A shRNA lentiviruses. NT2 represents mock-transduced cells, and PLK represents cells transduced with empty pLKO.1 vector. *, p < 0.01 compared with identically treated NT2/D1 control cells. B, Western analysis of STK17A expression in NT2/D1 cells stably transduced with pLKO.1 and STK17A shRNA lentiviruses. The band for STK17A is directly below the two nonspecific bands. C, dose response after 3-day cisplatin treatment of mock-transduced NT2/D1 cells or cells transfected with control or STK17A shRNA lentiviruses. Cell proliferation and survival were measured by the Cell-Titer Glo assay. *, p < 0.05; **, p < 0.01 compared with identically treated NT2/D1 control cells. Data points are the average of biological triplicates. Error bars are S.D. Data are representative of three independent experiments.
FIGURE 6.
FIGURE 6.
STK17A knockdown results in decreased cisplatin-mediated apoptotic cell death. A, cell cycle analysis of NT2/D1 control, NT2-PLK, and NT2-STK17A-sh2 cells indicates fewer apoptotic sub-G1 cells upon cisplatin (Cispl) treatment of STK17A knockdown cells compared with control cells, whereas cell cycle phase distributions are similar. B, graph of data in A along with additional cisplatin dosages. Tx, treatment; Cont, control.
FIGURE 7.
FIGURE 7.
STK17A modulates ROS. A, NT2-STK17Ash2 cells express higher levels of metallothionein genes MT1M, MT1H, and MT1X compared with NT2-PLK control cells as determined by real time PCR. Data points are the average of biological triplicates. Error bars are S.D. *, p < 0.02. B, NT2/D1 cells stably expressing STK17A shRNAs (Sh1 and Sh2) have lower basal and cisplatin-induced ROS levels than control cells (PLK) as measured by the 2′,7′-dichlorodihydrofluorescein diacetate assay. Cells were incubated with or without 1 μm cisplatin for 18 h prior to ROS determination as described under “Experimental Procedures.” Tracings of representative basal ROS determinations in NT2-STK17A-sh1, NT2-STK17A-sh2, and NT2-PLK cells are shown. Bars are the average of two biological replicates, and error bars are the ranges of the two values. The experiment was repeated with similar results. C, 293T cells overexpressing STK17A have higher basal ROS levels. Cells were mock-transfected or transfected with empty vector or an expression plasmid for STK17A, and ROS levels were determined 24 h later. Representative tracings are at left. Bars represent the average of biological triplicate transfections, and error bars are S.D. *, p < 0.005 compared with mock or vector controls. The inset is a Western blot of STK17A overexpression. The experiment was repeated with similar results. M, mock; V, vector.

Similar articles

Cited by

References

    1. Zilfou J. T., Lowe S. W. (2009) Cold Spring Harb. Perspect. Biol. 1, a001883. - PMC - PubMed
    1. Gottlieb E., Vousden K. H. (2010) Cold Spring Harb. Perspect. Biol. 2, a001040. - PMC - PubMed
    1. Beckerman R., Prives C. (2010) Cold Spring Harb. Perspect. Biol. 2, a000935. - PMC - PubMed
    1. Einhorn L. H. (2002) Proc. Natl. Acad. Sci. U.S.A. 99, 4592–4595 - PMC - PubMed
    1. Houldsworth J., Korkola J. E., Bosl G. J., Chaganti R. S. (2006) J. Clin. Oncol. 24, 5512–5518 - PubMed

Publication types

MeSH terms